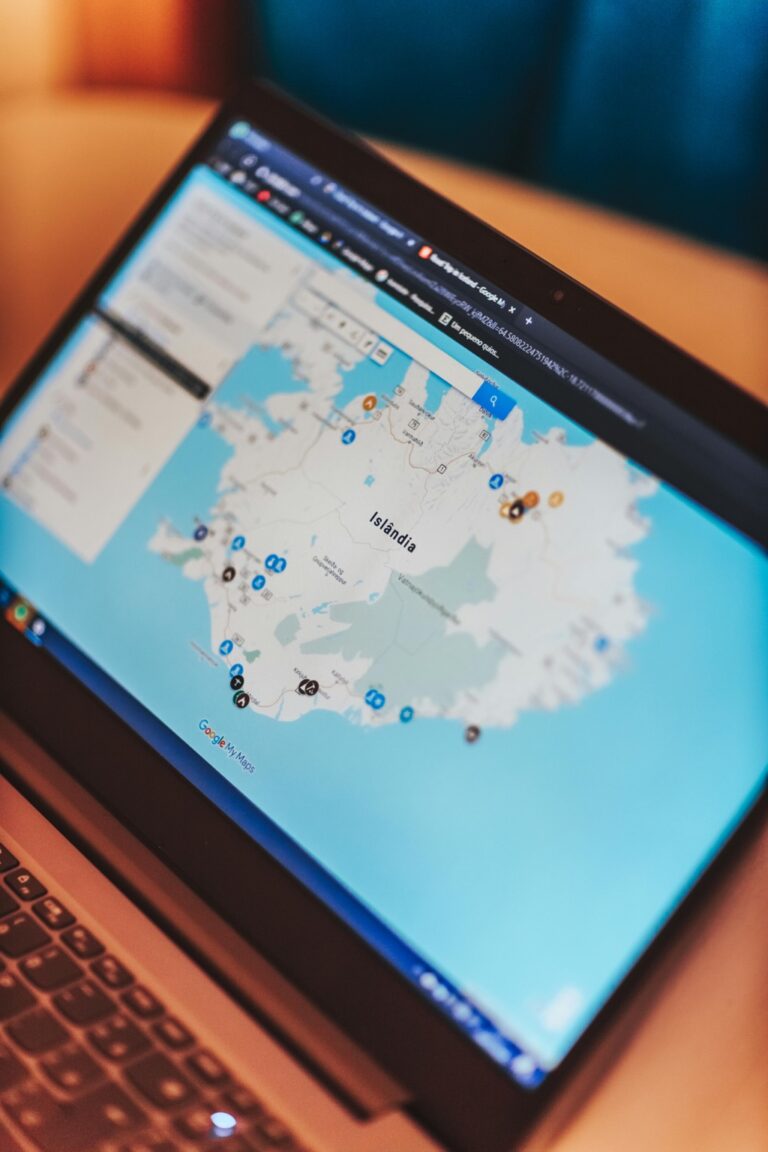
10 Best Map Visualization Software for Complex Datasets to Unlock Insights
In today’s data-driven world, visualizing complex datasets is crucial for effective decision-making. The right map visualization software can transform raw data into insightful visual stories that reveal patterns and trends. Discovering the best tools for this task can elevate your analysis and enhance your presentations.
Key Features of Best Map Visualization Software for Complex Datasets
When choosing map visualization software for complex datasets, specific features can greatly enhance your data analysis and presentation. Here are the key features to consider:
User-Friendly Interface
Map visualization software should have an intuitive interface. You’ll want tools that allow for easy navigation and quick access to essential functions. Programs like ArcGIS Online provide drag-and-drop capabilities, simplifying the mapping process for users at all skill levels. With such interfaces, you can focus more on your data without getting bogged down by complex controls.
Compatibility with Various Data Formats
Your chosen software needs to handle multiple data formats effortlessly. This compatibility is crucial for integrating datasets from various sources. Tools like Tableau support formats such as CSV, Excel, and spatial files like shapefiles. By using compatible formats, you can streamline your workflow and ensure that all pertinent data is included in your visualizations.
Customization and Styling Options
Effective map visualizations require personalization to convey specific narratives. You should look for software that offers robust customization features, such as QGIS, where you can adjust colors, symbols, and labels. Custom styling helps you create maps that resonate with your audience and effectively highlight key trends or findings.
Analytical Capabilities
Advanced analytical features are essential for understanding complex data relationships. You want software that provides tools for geospatial analysis, such as Mapbox, which allows for the application of statistical models. With strong analytical capabilities, you can derive deeper insights and make informed decisions based on your data visualizations.
Top 5 Best Map Visualization Software for Complex Datasets
Choosing the right map visualization software can significantly impact how you interpret and present complex datasets. Here are five of the best tools tailored for efficiency and effectiveness.
1. ArcGIS Online
ArcGIS Online, offered by Esri, stands out with its robust GIS capabilities and cloud-based convenience. It allows you to create professional-grade maps quickly and collaborate seamlessly with teams. You’ll find features such as detailed spatial analysis tools and a rich content library filled with ready-made datasets. This software also supports digital twin creation and optimized asset management, providing location-based insights for informed decision-making.
2. Tableau
Tableau is an industry leader in data visualization, especially for interactive maps. You can easily transform complex datasets into compelling visuals that update in real time. With its drag-and-drop interface, it’s accessible for users at all skill levels. Tableau integrates seamlessly with various data sources, allowing you to explore and analyze geographic data while making informed visual narratives that enhance your presentations.
3. Google Maps Platform
Google Maps Platform leverages the extensive capabilities of Google’s mapping services to offer powerful visualization tools. You can customize maps to display specific data points using its robust APIs. This platform conveniently provides location data alongside dynamic updates, making it an excellent choice for applications that require geographical accuracy and user interactivity. It’s suitable for various industries, from logistics to urban planning.
4. Mapbox
Mapbox excels in customization and flexibility, allowing you to create visually stunning maps tailored to specific needs. You can utilize its powerful design tools to integrate your datasets into unique visual formats. This software supports various programming languages and frameworks, making it ideal for developers needing deep integration. Mapbox’s interactive capabilities enhance user engagement by allowing real-time feedback on data.
5. QGIS
QGIS is an open-source GIS software that offers extensive mapping capabilities without the cost of proprietary tools. You can analyze complex datasets using its vast plugin ecosystem and flexible styling options. QGIS supports multiple data formats, which is crucial for integrating various sources. Its community-driven support ensures you have access to an array of resources and tutorials, making it a practical choice for both novices and experts.
Master ArcGIS Pro 3.2 with this comprehensive guide. Learn essential GIS workflows and data management techniques for effective spatial analysis.
How to Choose the Best Map Visualization Software for Complex Datasets
When you’re selecting map visualization software, defining your project’s requirements is crucial. Several factors will influence your choice and determine which tool best suits your needs.
Evaluate Your Specific Needs
Identify the types of data you’ll be working with and the desired outcome. For advanced spatial analysis, QGIS provides powerful tools and supports various formats, while ArcGIS Online excels at professional-grade mapping and collaboration. If you’re focusing on business intelligence, CARTO offers robust location analytics tailored for commercial use.
Consider Budget and Licensing Options
Examine your budget carefully. Free tools like QGIS offer extensive features without financial commitment, but may require investment in training. Alternatively, ArcGIS Online operates on a subscription model, delivering continuous updates and support, yet it can be costly. Determine upfront costs and ongoing fees to align with your financial resources and project scale.
Assess Community Support and Resources
Investigate the community and resources surrounding each software option. Popular platforms like QGIS and ArcGIS have strong community support, including forums, tutorials, and plugins. Accessibility to these resources can significantly ease the learning curve, providing invaluable assistance whether you are a novice or an experienced user. Ensure that the software you choose has ample documentation and an active user base to troubleshoot issues efficiently.
Benefits of Using Best Map Visualization Software for Complex Datasets
Choosing the right map visualization software streamlines your workflow and enhances the clarity of your data. Here are some critical benefits of utilizing the best tools for handling complex datasets.
Enhanced Data Interpretation
Using map visualization software helps you convert raw data into intuitive visual formats. For instance, Tableau offers interactive maps that update in real-time, allowing you to easily spot patterns and trends. Its integration with databases and spreadsheets simplifies data interpretation and achieves more efficient analysis, making it a valuable asset in your mapping toolkit.
Improved Presentation of Complex Information
Map visualization software enhances the presentation of complicated datasets. CARTO, for example, not only creates aesthetically pleasing maps but also provides advanced analytics capabilities. By visualizing spatial relationships and data correlations effectively, you can communicate your findings more clearly and impactfully to a diverse audience.
Streamlined Collaboration and Sharing
Using advanced mapping software fosters better collaboration among teams. With tools like ArcGIS Online, you can easily share interactive maps with colleagues or stakeholders, enabling seamless collaboration. This real-time access to visual data promotes informed decision-making and enhances teamwork by allowing everyone involved to explore and engage with the data dynamically.
Conclusion
Choosing the right map visualization software can significantly impact how you interpret and present complex datasets. By leveraging the right tools, you can transform raw data into compelling visual narratives that drive better decision-making.
Remember to consider your specific needs and project requirements when evaluating options. Whether you prioritize ease of use, customization, or advanced analytical capabilities, there’s a solution tailored for you.
Investing in the best map visualization software not only enhances your data analysis but also fosters collaboration and effective communication within your team. Embrace these tools to unlock the full potential of your data and elevate your presentations to new heights.


