10 Best 3D Visualization Tools for Geographic Data That Enhance Clarity
In a world where data drives decisions, visualizing geographic information in 3D can transform how you understand complex landscapes. The right tools not only enhance your analysis but also make your presentations more compelling. Discover the best 3D visualization tools that can elevate your geographic data projects and help you uncover insights like never before.
ArcGIS Pro
ArcGIS Pro stands out for robust geospatial analysis and visualization features. You can easily create 3D scenes with layered data and realistic environments, making it ideal for urban planning and environmental assessments.
QGIS with Qgis2threejs Plugin
QGIS is an open-source alternative that, combined with the Qgis2threejs plugin, allows you to generate interactive 3D visualizations. It’s user-friendly, making it suitable for both beginners and experienced mapmakers.
Google Earth Pro
Master Google Earth Pro to enhance your real estate business. Visualize properties and analyze locations with powerful mapping tools.
Google Earth Pro offers a well-known platform for 3D visualization. You can import various geographic data formats and overlay them on a 3D globe, which is excellent for presenting data in an engaging manner.
CesiumJS
CesiumJS is a powerful JavaScript library for creating 3D globe applications. It’s particularly useful for developing web-based geospatial visualization platforms, enabling you to manipulate and showcase large datasets interactively.
Potree
Potree specializes in visualizing point clouds in 3D. You can handle large-scale LiDAR data with ease, making it an excellent choice for forestry, mining, and urban modeling applications.
Common Technical Issues
As you explore these tools, you might encounter issues such as data compatibility and rendering performance. Ensure you’re working with supported file formats and maintaining manageable data sizes to optimize visual output.
Data Visualization Options
Consider your target audience when choosing visualization methods. Some tools provide advanced customization, allowing you to convey complex data effectively while maintaining readability and clarity.
Workflow Frameworks
Establish a structured workflow when using these tools:
- Data Collection: Gather reliable and relevant data.
- Data Preparation: Clean and format your data for compatibility.
- Visualization Development: Create visualizations tailored to your project’s needs.
- Review and Quality Assurance: Regularly check the accuracy and effectiveness of your visualizations.
Quality Control Tips
Implement ongoing quality assurance procedures to ensure your 3D visualizations remain accurate and comprehensible. Regularly validate your data sources and keep abreast of industry standards. This diligence will elevate your mapping projects and enhance their educational and informational value.
Understanding 3D Visualization Tools for Geographic Data
3D visualization tools for geographic data are essential in translating complex datasets into tangible, visual formats. These tools help you accurately represent the Earth’s surface and its features, facilitating a better understanding of geographic relationships.
Definition of 3D Visualization
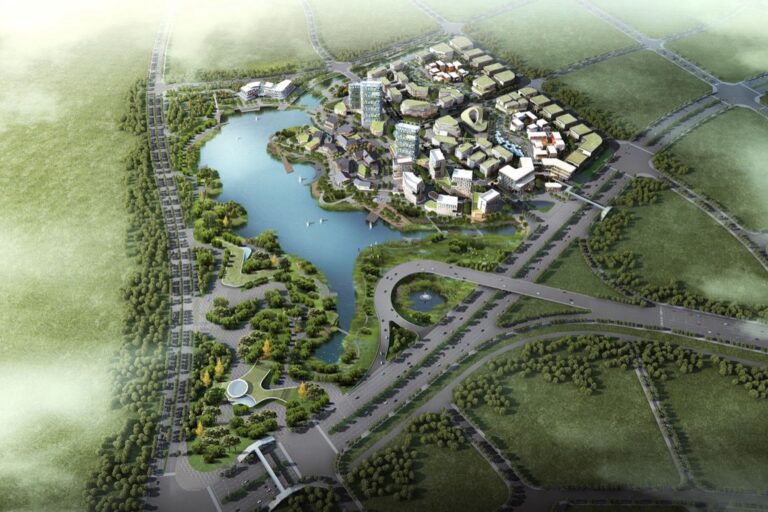
3D visualization refers to the technique of creating three-dimensional representations of geographical data. It includes modeling terrain, urban landscapes, and other spatial elements, allowing you to visualize features more realistically compared to traditional 2D maps. This enhanced perspective helps you grasp intricate relationships among geographical elements, as topography and structures interact dynamically.
Importance of Geographic Data Visualization
Geographic data visualization is critical for enhancing understanding and decision-making processes. By transforming raw data into visual formats like 3D maps, you can identify patterns, trends, and anomalies effectively. This approach is invaluable in fields such as urban planning, environmental management, and disaster response, where clear visual communication can dictate effective strategy development. Engaging tools such as ArcGIS Pro and Google Earth Pro empower you to present findings compellingly, improving overall project impact.
Top 5 Best 3D Visualization Tools for Geographic Data
3D visualization tools are essential for enhancing your understanding of geographic data. Here are five of the best tools that can help you present your data effectively.
1. ArcGIS Pro
ArcGIS Pro excels in transforming 2D geographic data into dynamic 3D scenes. You can create immersive visuals by incorporating height attributes. This tool supports advanced features like display options, animations, and temporal data analysis, allowing you to effectively communicate complex spatial relationships. By using the time slider, you can visualize changes over time, improving your audience’s grasp of geographic phenomena. Expect an intuitive interface that integrates seamlessly with other ESRI products, making it a go-to choice for professional cartographers.
2. QGIS
QGIS is a powerful open-source tool that excels in 3D visualization of geographic data. It offers a range of functionalities ideal for both novice and seasoned cartographers.
Features and Benefits
- 3D Visualization: QGIS supports advanced 3D map rendering, allowing you to view terrain and other geographic features in three dimensions. This capability is invaluable for understanding complex spatial relationships.
- Integrated GRASS Tools: QGIS seamlessly integrates with GRASS GIS, providing over 400 modules for advanced geoprocessing. This integration enhances your ability to conduct thorough terrain analysis and hydrology studies.
- Processing Plugin: The Processing plugin allows you to access a host of algorithms from native and third-party sources. This feature enables sophisticated 3D modeling and analysis tasks, expanding your analytical toolkit.
- Urban Planning: You can use QGIS to create 3D models of urban landscapes, aiding in effective planning and development decisions.
- Environmental Studies: QGIS’s 3D capabilities help visualize environmental features such as flood zones and erosion patterns, improving understanding of critical ecological processes.
- Construction Projects: Engineers can leverage QGIS for visualizing site plans and assessing the impact of new developments on surrounding areas.
- Tourism Promotion: You can create engaging 3D maps to showcase natural attractions, enhancing tourism marketing efforts.
By employing QGIS, you align with industry standards in mapping, providing a comprehensive view of spatial data that informs better decision-making and project outcomes.
3. Google Earth Pro
Explore Earth observation using Google Earth Engine and AI. This book provides practical algorithms and sustainable applications for analyzing geospatial data.
Google Earth Pro serves as a robust tool for visualizing geographic data in a detailed, 3D environment. It offers extensive features tailored to enhance your mapping projects and facilitate spatial analysis.
Features and Benefits
- High-Resolution Imagery: Google Earth Pro provides sharp, high-resolution images of the Earth, allowing you to analyze geographic data with precision.
- GIS Integration: You can import and export various GIS data formats, particularly KML files, making it versatile for integrating with other mapping tools.
- Historical Imagery Access: You can explore historical imagery to understand changes over time, facilitating comprehensive analyses.
- Custom Mapping: You can create personalized maps and tours, enhancing presentations and making data storytelling effective.
- Urban Planning: You can utilize Google Earth Pro to visualize urban landscapes, aiding in the evaluation of new developments and infrastructure projects.
- Environmental Studies: You can analyze land use changes and monitor environmental impacts by using historical imagery and spatial data layering.
- Disaster Management: You can create detailed maps for emergency response, highlighting vulnerable areas and resources for rapid assessments.
- Tourism Development: You can design engaging virtual tours that showcase points of interest, enhancing tourism marketing efforts.
By integrating Google Earth Pro into your mapping toolkit, you can effectively elevate your geographic data projects, ensuring clarity and engagement in your presentations.
4. CesiumJS
CesiumJS is a powerful library designed for interactive 3D mapping and geographic data visualization. Its capabilities help you present complex datasets in a manner that’s both engaging and insightful.
Features and Benefits
- High-Performance Visualization: CesiumJS excels in rendering 3D globes and maps smoothly in web browsers, supporting a seamless user experience.
- Terrain Rendering and Satellite Imagery: It integrates high-resolution satellite imagery and detailed terrain rendering, making it efficient for visualizing extensive datasets.
- Dynamic Data Layers: You’ll appreciate the ability to showcase real-time dynamic data layers, critical for applications needing immediate updates in visualization.
- 3D Tiles: By utilizing 3D Tiles, it manages complex 3D data efficiently, significantly improving streaming and rendering performance.
- Urban Planning: CesiumJS helps visualize urban environments, allowing planners to simulate development impacts on city landscapes.
- Environmental Monitoring: You can use it to display environmental changes over time, aiding in resource management and conservation efforts.
- Disaster Management: The library enables the integration of real-time data layers, essential for emergency response and planning.
- Transportation Analysis: Visualizations can enhance transport modeling and spatial analyses, providing stakeholders with interactive maps for better decision-making.
CesiumJS stands out with its robust features and versatile applications, making it an indispensable tool for modern cartographers. By leveraging its capabilities, you can elevate your geographic data presentations and enhance stakeholder engagement.
5. Blender
Blender is a powerful tool for 3D visualization of geographic data, offering a range of features tailored to meet various mapping challenges.
Features and Benefits
Blender provides comprehensive 3D modeling and rendering capabilities for geospatial data. You can import and visualize GIS data like point clouds and vector datasets easily. It supports customizable visualizations, allowing you to achieve high levels of detail in your maps. Blender integrates a georeferencing system, enabling accurate alignment of scenes with real-world coordinates. This ensures that your representations maintain the spatial integrity necessary for effective analysis.
Use Cases in Geographic Data
You can leverage Blender’s versatility in various domains. In urban planning, for instance, it allows you to create immersive visualizations that effectively communicate complex spatial relationships. Environmental studies benefit from Blender’s ability to render detailed terrain models, helping to illustrate changes in land use over time. Additionally, Blender can effectively visualize data from LiDAR surveys, enhancing your presentations with striking 3D imagery. These use cases demonstrate how Blender can elevate your geographic data projects, making them more interactive and informative.
Comparing the Best 3D Visualization Tools for Geographic Data
Creating effective geographic maps can present substantial challenges, particularly when attempting to portray complex datasets clearly and engagingly. You might find that manipulating volumetric data or integrating various data types becomes cumbersome without the right tools and approaches.
Establishing the Technical Context
Your mapping process should begin with a solid understanding of the tools available. Industry-standard Geographic Information System (GIS) software, such as ArcGIS Pro and QGIS, offers a range of capabilities to tackle both 2D and 3D mapping challenges. Understanding the strengths and limitations of these tools is crucial in any mapping project. For example, while ArcGIS Pro delivers advanced spatial analysis, QGIS offers flexibility and user-friendliness, making it ideal for quick visualizations.
Key Methods with Tool Examples
- 3D Visualization: Leverage tools like Blender for intricate modeling. You can import GIS data seamlessly, providing realistic visualizations for urban planning or environmental assessments.
- Data Processing: Utilize GRASS GIS for robust geoprocessing tasks. With over 350 modules, it supports complex analyses, allowing you to explore intricate geographic relationships.
- Web Visualization: CesiumJS can aid in rendering web-based 3D globes and maps. Its ability to handle real-time updates can enhance interactive presentations of geographic data.
Addressing Common Technical Issues
You may encounter issues like data formatting inconsistencies or performance slowdowns. Using standardized data formats such as GeoJSON or shapefiles can alleviate compatibility problems. Moreover, optimizing your datasets by simplifying geometry can significantly enhance performance, especially when rendering large volumes of 3D data.
Exploring Data Visualization Options
Selecting appropriate visualization techniques is essential for clarity. For instance, heat maps can effectively showcase concentrations of data points, while Potree excels in visualizing large-scale LiDAR data. Explore color gradients and 3D extrusion to transform flat data into compelling visual narratives, thereby enhancing viewer engagement and understanding.
Providing Workflow Frameworks
A systematic workflow can streamline your mapping process:
- Data Collection: Gather data from reliable sources such as government repositories or academic institutions.
- Preparation: Clean and preprocess the data using tools like QGIS for seamless integration into visualization software.
- Visualization Development: Employ software like ArcGIS Pro or Google Earth Pro to create dynamic visualizations.
- Quality Assurance: Implement regular audits of your maps to ensure accuracy and clarity with QA/QC protocols.
Quality Control Tips
Lastly, maintaining high standards in your mapping projects is paramount. Regularly cross-check your geographic data against authoritative sources for precision. Engage colleagues for peer reviews, ensuring multiple sets of eyes evaluate the visualization. Document every change made during the mapping process to maintain a clear trail for future reference.
By addressing these essential elements, you can elevate your mapping craft, create compelling geographic narratives, and communicate complex data effectively.
Tips for Choosing the Best 3D Visualization Tool
Selecting the right 3D visualization tool is crucial for effectively representing your geographic data. Here are key considerations to keep in mind during your evaluation.
Assessing Your Geographic Data Needs
- Identify your data type, such as LiDAR, satellite imagery, or vector data. Tools like GRASS GIS excel in handling complex datasets through extensive geoprocessing capabilities.
- Consider the complexity of your projects. If you’re engaged in urban planning or architectural visualization, Esri’s ArcGIS offers advanced analytical features for detailed insights.
- Analyze your budget constraints. Open-source tools like QGIS provide robust options without licensing fees, making them accessible for both amateurs and professionals.
- Assess available resources, including hardware requirements. Tools like Google Earth Pro lead with low system demands while delivering high-resolution visualizations, enhancing your mapping projects without costly upgrades.
Conclusion
Choosing the right 3D visualization tool for your geographic data can significantly enhance your projects. By leveraging the strengths of tools like ArcGIS Pro, QGIS, Google Earth Pro, CesiumJS, and Blender, you can create compelling visual narratives that resonate with your audience.
Remember to assess your specific needs and the complexity of your data when making your selection. With the right tool in hand, you’ll be well-equipped to transform complex geographic information into engaging and informative visualizations. This not only aids in better understanding but also drives effective decision-making in various fields.


