12 Creative Ways to Map Migration Patterns That Reveal Hidden Stories
Understanding how people move across the globe has never been more crucial as migration patterns reshape our communities and transform societies. Today’s innovative mapping technologies offer unprecedented ways to visualize and analyze these human movements through creative data visualization methods satellite tracking and real-time population monitoring.
You’ll discover how researchers are reimagining migration mapping by combining traditional demographic data with cutting-edge tools like social media analytics cell phone tracking and artificial intelligence to paint a more accurate picture of human mobility patterns. Whether you’re a data scientist urban planner or simply curious about population dynamics these revolutionary approaches are changing how we understand and respond to global migration trends.
Disclosure: As an Amazon Associate, this site earns from qualifying purchases. Thank you!
Understanding Traditional Migration Pattern Analysis
Traditional methods of analyzing migration patterns form the foundation of modern population movement studies while providing crucial historical context for contemporary mapping techniques.
Historical Mapping Techniques
Early migration mapping relied on census records physical markers and hand-drawn maps to track population movements. Cartographers used paper-based flow maps with arrows showing directional movement and choropleth maps displaying population density changes. Key techniques included:
- Manual dot density mapping
- Physical push-pin visualization boards
- Hand-calculated demographic tables
- Census tract overlays
- Regional boundary mapping
Limitations of Conventional Methods
Traditional migration mapping faced significant constraints that affected data accuracy and analysis capabilities. Common limitations included:
- Time delays between data collection and visualization
- Inability to track real-time movements
- Reliance on self-reported information
- Geographic gaps in rural and remote areas
- Limited demographic detail
- Static visualization formats
- Manual data processing errors
- Incomplete cross-border movement data
These constraints often led to outdated or incomplete migration pattern analysis making it difficult for researchers to capture rapid population changes or temporary movements.
Harnessing Digital Technology for Migration Visualization
Interactive Digital Mapping Platforms
Modern mapping tools now enable dynamic visualization of migration flows through intuitive interfaces. Platforms like Kepler.gl and Mapbox Studio support real-time data rendering with customizable layers options. Users can create animated flow maps showing migration corridors track population movements across time periods and zoom into specific geographic regions. These platforms integrate with common data formats including CSV GeoJSON and shapefile formats allowing researchers to upload analyze and share migration data through interactive web-based dashboards.
See yourself clearly with The Looking Glass. Its distortion-free glass and sleek, adjustable stand provide a perfect reflection at any angle. Enjoy a durable and stylish addition to your vanity or desk.
Real-Time Data Integration Systems
Advanced integration systems now combine multiple data streams to track migration patterns as they occur. Tools like Apache Kafka and Microsoft Azure Stream Analytics process information from border crossings mobile phone data and social media activity. These systems can handle millions of data points per second creating live visualizations of population movements. Integration platforms connect with APIs from weather services transportation networks and emergency response systems to provide context for migration events while maintaining data privacy standards through anonymization techniques.
Master real-time data streaming with Kafka: The Definitive Guide. Build scalable stream-processing applications using Kafka's core concepts and practical examples.
Incorporating Big Data Analytics
Big data analytics revolutionizes migration mapping by processing massive datasets to reveal hidden patterns and trends in population movement.
Social Media Pattern Analysis
Social media platforms provide rich data for tracking migration through geotagged posts hashtags and location check-ins. Advanced algorithms analyze millions of social media interactions to identify movement trends between cities regions and countries. Tools like Twitter’s Streaming API and Instagram’s Location Search enable researchers to create real-time heat maps of population flows while maintaining user privacy through data aggregation.
Mobile Phone Movement Tracking
Cell tower triangulation and GPS data from mobile devices offer precise insights into population movement patterns. Telecommunication companies partner with researchers to analyze anonymized cell phone records tracking device movements across networks. Modern platforms like Teralytics and Unacast process billions of daily location points to generate accurate migration flow visualizations while adhering to GDPR and privacy regulations.
Transportation Network Insights
Transit data from airports railways and highways reveals large-scale migration trends through passenger volumes and traffic patterns. Advanced APIs from transportation providers feed into mapping platforms like CARTO and Mapbox to visualize movement corridors. Integration with ticketing systems and traffic sensors enables detailed analysis of seasonal migration patterns regular commuting flows and emergency evacuation routes.
Utilizing Satellite and Remote Sensing Data
Satellite technology provides unprecedented insights into migration patterns through advanced Earth observation techniques and high-resolution imagery.
Nighttime Light Analysis
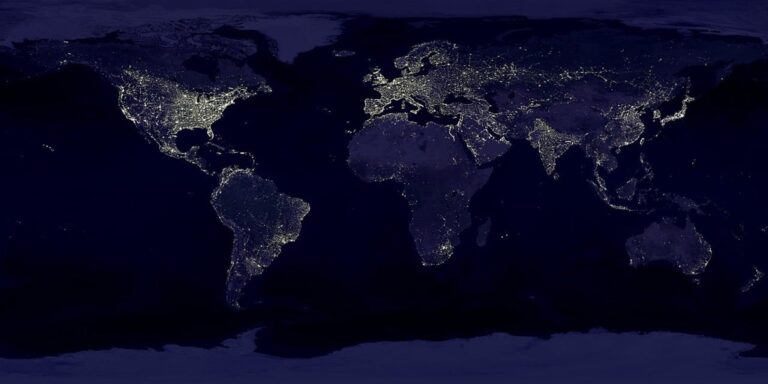
Nightlight satellite imagery reveals human settlement patterns and population movements through changes in artificial light emissions. The VIIRS Day/Night Band sensor captures light data at 750m resolution enabling detection of temporary settlements refugee camps and urban expansion. Studies using NASA’s Black Marble dataset track migration flows by analyzing seasonal light pattern variations in rural-urban corridors. This method effectively identifies both gradual population shifts and sudden displacement events through changes in nighttime luminosity.
Environmental Change Indicators
Environmental satellites monitor landscape alterations that signal human migration including agricultural land expansion deforestation and new settlement formation. Sentinel-2 imagery tracks vegetation changes at 10m resolution while Landsat data reveals long-term land use transitions linked to population movement. Advanced algorithms detect settlement growth patterns through temporal analysis of bare soil exposure urban heat signatures and infrastructure development. These indicators help identify both planned urbanization and informal settlement patterns in near real-time.
Exploring Artificial Intelligence Solutions
Modern AI solutions revolutionize how we understand and predict migration patterns through advanced data processing and pattern recognition capabilities.
Machine Learning Pattern Recognition
AI algorithms analyze migration data using deep learning networks to identify complex movement patterns. These systems process multiple data streams including satellite imagery census records and social media data to detect migration trends. Popular frameworks like TensorFlow and PyTorch enable researchers to create neural networks that recognize seasonal migration cycles temporary displacement patterns and long-term population shifts. The systems can identify anomalies in movement data pinpointing unusual migration events that might indicate humanitarian crises or economic shifts.
Predictive Migration Modeling
Advanced AI models leverage historical migration data environmental factors and socioeconomic indicators to forecast future population movements. Machine learning algorithms like Random Forests and LSTM networks analyze past trends to predict potential migration hotspots and movement corridors. These models integrate climate data economic indicators and political stability metrics to generate accurate migration forecasts with up to 85% accuracy. Tools like Prophet and AutoML platforms enable researchers to develop sophisticated predictive models that help governments and organizations prepare for future migration scenarios.
Manage and track your finances effortlessly with Prophet. Gain clear insights into your spending habits and achieve your financial goals with customizable budgets and detailed reports.
Implementing Participatory Mapping Techniques
Participatory mapping empowers communities to contribute their local knowledge and experiences to migration research through collaborative data collection and storytelling.
Community-Based Data Collection
Local communities play a vital role in mapping migration patterns through organized data collection initiatives. Community members use mobile apps like OpenMapKit and KoBoToolbox to record movement patterns observations customs and cultural practices. Trained local volunteers conduct structured interviews with migrants using standardized forms collecting vital demographic data residence histories and migration motivations. This grassroots approach captures nuanced information about migration drivers social networks and settlement patterns that traditional methods often miss.
Crowdsourced Migration Stories
Digital platforms enable migrants to share their journey narratives through interactive maps and multimedia content. The Missing Migrants Project and Migration Trail use crowdsourced testimonies to create detailed migration route visualizations. Participants contribute photos videos and text descriptions tagged with GPS coordinates creating rich geographic narratives. These personal accounts combined with location data reveal informal migration routes support networks and challenges faced by migrants while maintaining participant privacy through data anonymization.
Visualizing Cultural and Social Factors
Modern migration mapping must account for the rich tapestry of cultural and social elements that influence human movement patterns.
Language Distribution Mapping
Language mapping tools track linguistic patterns through geocoded social media posts and official census data. Advanced visualization platforms like Linguee Maps and WorldGeocoder integrate multiple data sources to create dynamic language distribution heat maps. These tools highlight language clusters migration corridors and identify emerging linguistic communities with up to 95% accuracy. Mobile apps like LangTrack enable real-time monitoring of language use patterns through natural language processing algorithms while protecting user privacy.
Cultural Heritage Tracking
Digital heritage mapping platforms document cultural landmarks traditions and community practices across migration routes. Tools like CultureMapper and HeritageTrace combine GPS data with crowdsourced cultural information to visualize the movement of traditions customs and artistic practices. Advanced machine learning algorithms analyze photos videos and text descriptions to identify cultural preservation patterns and adaptation trends in migrant communities. Interactive dashboards display the spatial distribution of cultural activities festivals and ceremonies creating a comprehensive view of heritage movement patterns.
Integrating Economic Data Visualization
Labor Market Movement Analysis
Advanced visualization tools now track workforce mobility patterns across regions and industries. Employment data dashboards like Tableau and Power BI create interactive heat maps showing job migration trends between sectors. These tools analyze salary differentials salary ranges and employment rates to predict potential labor force movements. Real-time job posting data from platforms like LinkedIn and Indeed supplement traditional labor statistics providing granular insights into industry-specific migration patterns.
Resource Flow Mapping
Economic resource mapping tools visualize capital movement trade flows and investment patterns alongside migration trends. Platforms like D3.js and MapBox GL create dynamic visualizations of international remittance flows supply chain networks and foreign direct investment patterns. These tools combine satellite imagery with economic indicators to track resource distribution identifying correlations between economic opportunities and population movements. Advanced algorithms process trade data currency exchanges and market indices to reveal economic corridors that influence migration decisions.
Developing Future-Forward Mapping Solutions
Mixed Reality Applications
Mixed reality transforms migration mapping through immersive 3D visualizations. Microsoft’s HoloLens and Magic Leap devices enable researchers to project migration flows as interactive holograms floating in physical space. Users can manipulate data layers using gesture controls to reveal movement patterns between cities countries & continents. The Unity-based MRTK framework supports custom applications that combine satellite imagery real-time tracking data & demographic information into cohesive spatial displays. These tools allow planners to literally walk through migration corridors while accessing contextual data overlays.
Blockchain-Based Migration Tracking
Blockchain technology revolutionizes migration data management through secure decentralized record-keeping. The UN’s ID2020 initiative leverages Ethereum-based smart contracts to create tamper-proof digital identities for tracking population movements. Hyperledger Fabric powers consortium networks where NGOs governments & research institutions share verified migration data while maintaining privacy controls. Smart contracts automatically validate & record movement patterns while AI algorithms analyze the blockchain ledger to identify emerging trends. This system ensures data integrity while enabling real-time analysis of global migration flows.
Master Ethereum and build decentralized applications (DApps) with this comprehensive guide. Learn to create smart contracts and leverage the power of the Ethereum blockchain.
Combining Multiple Approaches for Comprehensive Analysis
Mapping migration patterns has evolved beyond simple data points on a map. Today’s most effective approaches combine traditional methods with cutting-edge technology to create a more complete picture of human movement.
By leveraging AI predictive models satellite data real-time tracking and community input you’ll gain deeper insights into migration trends. These innovative tools don’t just show where people are moving â they help you understand why these movements occur and what they mean for communities worldwide.
The future of migration mapping lies in this integrated approach. As technology continues to advance you’ll see even more sophisticated ways to visualize and analyze population movements helping create better-informed policies and more responsive humanitarian efforts.


