8 Ways to Evaluate Projection Distortions That Transform Digital Maps
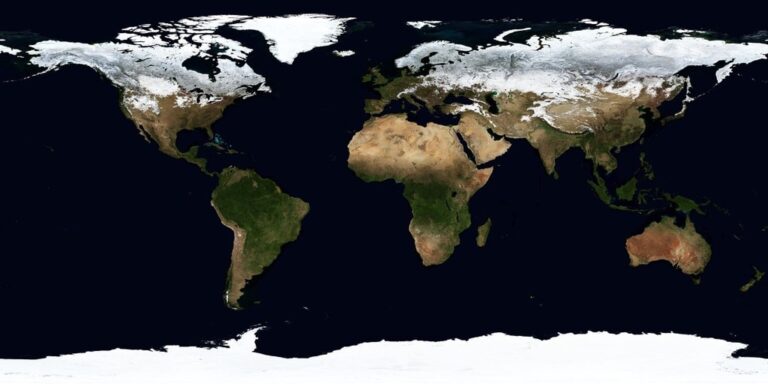
When you look at a world map you might not realize that it’s impossible to perfectly represent our spherical Earth on a flat surface without some form of distortion. Cartographers must carefully choose map projections that balance different types of distortions – including shape area scale and direction – based on the map’s intended purpose and geographic region. Understanding these projection distortions is crucial for anyone working with geographic data from urban planners and surveyors to students and researchers.
The challenge of evaluating map projections lies in recognizing how each type of distortion affects the final representation and knowing which compromises are acceptable for your specific needs. Modern GIS tools have made it easier to analyze and visualize these distortions but selecting the right projection still requires careful consideration of mathematical principles and cartographic goals.
Disclosure: As an Amazon Associate, this site earns from qualifying purchases. Thank you!
Understanding Map Projections and Their Inherent Distortions
Types of Map Projections
Map projections fall into four primary categories based on their geometric properties. Cylindrical projections wrap the Earth’s surface around a cylinder resulting in straight meridians and parallels like the Mercator projection. Conic projections use a cone to transfer Earth’s features creating curved parallels with straight meridians like the Albers projection. Azimuthal projections project onto a flat plane touching Earth at one point producing circular parallels like the Stereographic projection. Pseudocylindrical projections curve meridians while keeping parallels straight like the Robinson projection.
P.S. check out Udemy’s GIS, Mapping & Remote Sensing courses on sale here…
The Impossibility of Perfect Projections
No map projection can preserve all geographic properties simultaneously due to the fundamental challenge of transforming a spherical surface onto a flat plane. This mathematical limitation forces every projection to distort at least one of these elements: shape area distance or direction. The amount of distortion increases as you move away from the projection’s standard lines or points. For example the Mercator projection maintains shape but greatly exaggerates area near the poles while equal-area projections preserve size but distort shapes significantly at the map edges.
Measuring Angular Distortions in Map Projections
Tissot’s Indicatrix Method
Tissot’s Indicatrix provides a powerful visualization tool for analyzing angular distortions in map projections. The method uses small circles plotted on a map that transform into ellipses when projected showing local deformation patterns. These indicatrices reveal how angles directions and shapes change across different regions of the map displaying maximum and minimum scale factors at each point. By examining the ratio between the semi-major and semi-minor axes of these ellipses you can quantify the amount of angular deformation at specific locations.
Computing Angular Deformation Patterns
Angular deformation calculations rely on measuring the deviation from right angles in projected coordinate systems. Start by computing the Jacobian matrix derivatives of the projection equations at each point. Calculate Tissot’s criterion E which measures maximum angular distortion using the formula E = 2arcsin((a-b)/(a+b)) where a and b represent the semi-major and semi-minor axes. Modern GIS software like QGIS and ArcGIS Pro includes built-in tools for automated angular distortion analysis providing numerical values in degrees.
Analyzing Area Distortions Across Projections
Area distortion analysis reveals how map projections affect the relative sizes of geographic features compared to their true proportions on Earth’s surface.
Scale Factor Analysis
Scale factor calculations quantify the amount of enlargement or reduction at specific points on your projected map. Using the h and k scale factors along parallels and meridians lets you compute area distortion as their product (hk). Tools like PROJ4 provide scale factor values with the command -ls. For cylindrical projections like Mercator the scale factor increases dramatically toward the poles following sec(φ) where φ is latitude. Modern GIS platforms display these values through built-in projection assessment tools.
Equal-Area Projection Assessment
Equal-area projections maintain correct relative sizes by ensuring the scale factor product (hk) equals 1.0 across the entire map. Test for equal-area properties by measuring identical areas at different locations using tools like ArcGIS Pro’s Measure tool or QGIS’s Area Calculator. Common equal-area options include Albers for continents Lambert Azimuthal for hemispheres and Mollweide for world maps. Compare area measurements between your projected data and a geodesic calculation to verify preservation of relative sizes.
Evaluating Distance Distortions in Cartographic Work
Great Circle Distance Comparisons
Measure true distances between points using great circle calculations to assess projection distortions. Great circle paths represent the shortest route between two locations on Earth’s surface following geodesic lines. Popular GIS tools like GeographicLib calculate these paths while comparing them to projected distances. Tools such as PostGIS ST_Distance_Spheroid or QGIS’s Geodesic Measure tool help quantify the difference between projected and true distances with accuracy levels up to 0.5 millimeters.
Scale Variation Effects
Monitor scale factors along different directions to understand how distances change across your map projection. Scale variation typically increases with distance from standard parallels or central meridians. Use tools like PROJ4’s cs2cs utility to compute scale factors at specific points showing expansion or compression of distances. For example the Mercator projection shows a scale factor of 2.0 at 60° latitude indicating distances are doubled compared to the equator. Modern GIS platforms offer scale factor visualization through distance distortion isolines.
Examining Shape Distortions in Different Projections
Conformality Testing
You’ll need to evaluate how well a projection maintains angular relationships using mathematical conformality tests. Apply Tissot’s criterion by measuring the radius ratios of projected circles at sample points across your map. For cylindrical projections like Mercator check that h=k (scale factors are equal) along meridians and parallels. Use GIS tools such as QGIS’s CRS validator or ArcGIS Pro’s projection engine to compute conformality metrics which should approach 1.0 for truly conformal projections.
Shape Preservation Analysis
Start your shape analysis by examining how basic geometric figures transform across different projections. Compare a grid of squares in the original geographic coordinates to their projected counterparts focusing on diagonal angles and side ratios. Check for local angular distortion using Flex Projector‘s built-in shape preservation tools or PROJ4’s cs2cs utility to measure deviation from right angles. Areas with shape distortion values exceeding 40° typically indicate significant deformation requiring consideration of alternative projections.
Enjoy immersive home entertainment and impactful presentations with the Epson EpiqVision Flex CO-W01 portable projector. Project bright, widescreen images up to 300" with 3,000 lumens and stream content easily via the HDMI port.
Comparing Regional vs Global Projection Accuracy
Map projections exhibit varying levels of accuracy depending on their geographic scope and intended use. Understanding these differences is crucial for selecting appropriate projections for specific mapping needs.
Local Distortion Patterns
Local distortion patterns show minimal impact within areas spanning 15° or less in latitude and longitude. You’ll find that conformal projections like UTM maintain angles accurately within these zones while introducing scale distortions of only 0.1% near zone centers. GIS tools like QGIS’s “Check Geometries” function can identify local distortion hotspots by analyzing geometry preservation across your area of interest. Regional projections like State Plane coordinate systems optimize accuracy for specific geographic areas by minimizing distortion within defined boundaries.
Continental Scale Impacts
Continental scale mapping requires careful consideration of increasing distortion effects. When mapping large landmasses like North America you’ll encounter scale factors varying by up to 5% from central meridians to edges using common projections like Lambert Conformal Conic. Equal-area projections like Albers perform better for continental analysis showing area variations below 2% across regions spanning 30° to 60° in latitude. Tools such as PROJ4’s cs2cs utility help quantify these larger-scale distortions by computing scale factors at multiple test points across continental extents.
Understanding Scale Factor Variations
Scale factors measure how distances on a projected map relate to actual ground distances varying across different locations and directions on the map surface.
Calculating Scale Factors
Scale factors can be computed using the partial derivatives of the projection equations with respect to latitude and longitude. For cylindrical projections use the formula k = sec(φ) where φ is the latitude. Modern GIS software like PROJ provides built-in scale factor calculations through functions like +proj=merc +scale_factor. The scale factor along the equator equals 1.0 while increasing toward the poles following mathematical relationships specific to each projection type.
Identifying Scale Change Patterns
Scale variations follow predictable patterns based on projection geometry. In UTM projections scale increases by approximately 0.01% per kilometer east or west of the central meridian. Mercator projections show exponential scale growth toward the poles with a factor of 2 at 60° latitude. Use tools like QGIS’s Scale Factor plugin to visualize these patterns through isolines connecting points of equal scale distortion.
Applying Digital Tools for Distortion Analysis
Digital tools have revolutionized the analysis of map projection distortions providing unprecedented accuracy and efficiency in cartographic assessment.
Modern Software Solutions
Leading GIS platforms like QGIS GRASS ArcGIS Pro and MapInfo Professional offer specialized tools for distortion analysis. QGIS’s Tissot Indicatrix plugin visualizes angular and areal distortions through interactive ellipses while ArcGIS Pro’s Projection Engine calculates precise scale factors. GeographicLib provides command-line utilities for computing geodesic measurements projections and grid transformations. These tools integrate seamlessly with existing workflows enabling rapid assessment of multiple projection options.
Computational Assessment Methods
Python libraries like pyproj and PROJ provide programmatic interfaces for distortion calculations across projection types. Key computational methods include:
- Jacobian matrix analysis for local deformation metrics
- Numerical integration for global distortion statistics
- Automated generation of distortion isolines
- Scale factor computation using partial derivatives
These methods enable batch processing of distortion analyses across large datasets facilitating comprehensive projection evaluation for specific mapping needs.
Selecting Appropriate Projections for Specific Uses
Purpose-Driven Selection Criteria
Select your map projection based on your primary cartographic goal: preserving area angle distance or direction. Use equal-area projections like Albers for thematic mapping density analysis or land coverage studies. Choose conformal projections such as Lambert Conformal Conic for navigation charts or meteorological maps. Opt for equidistant projections like Azimuthal Equidistant when measuring true distances from a central point. For global views prioritize compromise projections like Robinson or Winkel-Tripel which balance multiple distortions.
Regional Consideration Factors
Match your projection to your mapped region’s geographic extent and position. Use UTM zones for areas within 6° longitude bands near the equator. Select State Plane coordinates for US state-level mapping. Apply Lambert Conformal Conic for mid-latitude regions spanning east-west. Choose Polar Stereographic for areas above 60° latitude. Consider local map standards and coordinate systems used by regional agencies. Evaluate the region’s shape to determine optimal projection aspects standard parallels and central meridians.
Conclusion: Balancing Projection Trade-offs
Choosing the right map projection requires careful consideration of your specific mapping needs and understanding the inevitable trade-offs between different types of distortion. Modern GIS tools have made it easier to analyze and visualize these distortions but they can’t eliminate the fundamental challenge of representing our spherical Earth on a flat surface.
You’ll need to prioritize which cartographic properties are most crucial for your specific application – whether that’s preserving area shapes distances or directions. By leveraging digital tools and understanding distortion patterns you can make informed decisions that optimize your maps for their intended purpose while minimizing unwanted distortions.
Remember that no single projection will be perfect for every situation. Your success in cartographic work depends on finding the right balance between different types of distortion based on your project’s unique requirements and geographic scope.


