11 Ways 3D Elements Transform Flat Vector Maps Into Dynamic Masterpieces
Flat vector maps have evolved beyond their two-dimensional constraints with the strategic addition of 3D elements that bring depth and visual interest to cartographic design. By incorporating subtle shadows isometric perspectives and layered elements you can transform simple maps into engaging visual experiences that guide users through complex spatial information. These creative enhancements not only make your maps more visually appealing but also help users better understand geographic relationships and data hierarchies while maintaining the clean aesthetic that makes vector maps so effective.
Whether you’re designing for digital platforms print media or interactive applications the thoughtful use of 3D elements can elevate your map designs from functional to extraordinary. Modern design tools and techniques have made it easier than ever to experiment with depth perspective and dimensionality while keeping file sizes manageable and maintaining scalability across different platforms.
Disclosure: As an Amazon Associate, this site earns from qualifying purchases. Thank you!
Understanding the Evolution of Vector Map Design
The transformation of vector map design represents a significant shift in digital cartography showcasing the blend of traditional principles with modern visualization techniques.
P.S. check out Udemy’s GIS, Mapping & Remote Sensing courses on sale here…
Traditional Flat Map Design
Traditional flat vector maps emerged in the 1960s with the rise of computer-aided design featuring simple 2D representations of geographic data. These maps prioritized clarity through basic geometric shapes lines and solid colors. Key characteristics included minimal design elements uniform line weights consistent color schemes and standardized symbols. Popular mapping software like Adobe Illustrator and Inkscape helped establish these fundamental design conventions that focused on readability over decorative elements.
Introduction of 3D Elements
The integration of 3D elements began in the early 2000s as digital tools evolved to handle complex rendering. Modern vector maps now incorporate depth through techniques like drop shadows elevation indicators and layered components. Tools like Mapbox Studio Cinema 4D and Adobe After Effects enable designers to add isometric views terrain modeling and dynamic lighting effects. These 3D enhancements create spatial hierarchy improve data visualization and maintain vector scalability while adding visual interest to previously flat designs.
Mastering Core 3D Elements in Vector Maps
Isometric Building Representations
Transform your vector maps with isometric building designs that create instant visual depth. Render buildings at 30-degree angles to maintain consistent perspective across your map while using simple geometric shapes as building blocks. Apply height variations through scaled vertical extrusion to represent different building sizes accurately. Tools like Adobe Illustrator’s SSR effects or Mapbox’s fill-extrusion feature let you generate these 3D structures efficiently while preserving vector scalability.
Elevation and Terrain Features
Craft dynamic terrain representations using contour lines layered with gradient fills to simulate elevation changes. Implement stepped height levels through stacked vector paths that create natural topographic transitions. Add subtle texture patterns at 15-45% opacity to enhance depth perception while maintaining file optimization. Combine these elements with elevation markers and height indicators to provide clear spatial context for users navigating complex landscapes.
Shadow and Depth Effects
Deploy strategic shadow placement to enhance dimensional depth in your vector maps. Apply subtle drop shadows at 20-30% opacity with 2-4 pixel offsets to create natural light sources. Use graduated fills for cast shadows from buildings and terrain features maintaining consistent light direction. Implement multiply blend modes for overlapping shadows to prevent artificial-looking intersections while preserving the map’s clean vector aesthetic.
Implementing Essential Design Principles
Effective 3D elements in vector maps require careful attention to fundamental design principles that enhance both functionality and visual appeal.
Color Theory and Depth Perception
Apply color gradients strategically to create depth perception in your vector maps. Use darker shades for lower elevations and lighter tones for higher areas to simulate natural lighting conditions. Implement a maximum of 3 related hues within your color palette to maintain visual harmony while adding shadows at 45-degree angles with 30% opacity. Cool colors like blues and greens work best for receding elements while warm colors like oranges and reds help features appear closer to the viewer.
Scale and Proportion Guidelines
Maintain consistent scale ratios across all 3D elements to ensure realistic spatial relationships. Set building heights between 1:2 and 1:3 proportions relative to their footprint width for optimal visual balance. Keep terrain elevation exaggeration between 1.5x and 2x the actual height to enhance readability without distorting geographic accuracy. Use a standardized grid system with 8px increments to align all map elements including roads buildings and landmarks.
Visual Hierarchy Techniques
Structure your map elements using size contrast and positioning to guide viewer attention. Place primary landmarks 20% larger than surrounding buildings and use 50% more saturated colors for important features. Layer map elements with transportation networks at the base followed by terrain features buildings and finally labels or icons. Create focal points by increasing detail density in key areas while maintaining simplified representations in peripheral regions.
Creating Interactive 3D Vector Map Features
Interactive features transform static 3D vector maps into dynamic user interfaces that respond to viewer input.
Hover Effects and Animations
Implement smooth hover states to highlight map elements when users move their cursor over specific features. Add subtle animations like building extrusions that rise from 2D to 3D or terrain that gradually reveals elevation details. Use CSS transitions for web-based maps to control timing with properties like transform and transition-duration. Tools like Mapbox GL JS enable smooth state changes with interpolation functions that maintain vector quality during animations.
Dynamic Zoom Capabilities
Configure progressive level-of-detail rendering that adapts 3D elements based on zoom levels. At distant views show simplified building blocks then transition to detailed architectural features as users zoom in. Implement custom zoom thresholds in tools like THREE.js or Cesium to trigger different 3D model resolutions. Optimize performance by loading high-detail models only when needed through dynamic asset management.
Click-Through Interactions
Design clickable 3D elements that reveal additional information through pop-up windows or expanded views. Enable users to click buildings to display interior floor plans or terrain features to show elevation data. Use event listeners in JavaScript frameworks like React-Map-GL to handle click interactions. Implement raycasting techniques to accurately detect clicks on 3D objects even at oblique viewing angles.
Exploring Advanced 3D Mapping Techniques
Layered Information Display
Create dynamic depth in your vector maps by implementing strategic information layers. Stack data components like transportation networks roads hospitals and demographic information using z-index values between 100 and 1000. Modern mapping libraries like Mapbox GL JS and Three.js enable smooth transitions between layers with opacity controls. Set primary features at z-index 800 secondary elements at 500 and background layers at 200 to maintain clear visual hierarchy while preserving interactive functionality.
Custom 3D Icons and Markers
Design distinctive 3D markers using SVG paths and CSS transforms to indicate points of interest. Convert traditional 2D icons into 3D elements by applying perspective transforms (transform: rotate3d) and drop shadows. Popular tools like Figma and Illustrator support the creation of isometric icons at 120-degree angles. Implement hover states that animate markers from flat to dimensional using CSS transitions with 300ms duration for smooth user interaction.
Texture and Pattern Integration
Enhance map surfaces with vector-based textures that maintain scalability across zoom levels. Apply subtle patterns using SVG filters for terrain features like grasslands (diagonal lines at 45 degrees) water bodies (repeating wave patterns) and urban areas (dot matrices). Keep pattern density between 10-15% opacity to avoid visual clutter. Use tools like SVG Pattern Generator to create seamless repeating elements that work across different viewport sizes.
Optimizing Performance and Usability
Balancing visual appeal with technical efficiency ensures 3D vector maps remain accessible and functional across platforms.
File Size Management
Implement vector optimization techniques to maintain small file sizes while preserving 3D detail. Use SVG path optimization to reduce anchor points in complex shapes down to 25-50% without visible quality loss. Combine similar paths merge overlapping elements to minimize redundant code. Consider implementing level-of-detail (LOD) systems that load simplified versions of 3D elements at different zoom levels reducing initial load requirements by up to 60%.
Loading Speed Considerations
Structure your 3D vector elements to enable progressive loading based on viewport visibility. Prioritize loading essential map features first using techniques like lazy loading for off-screen content. Implement WebGL acceleration for complex 3D renders achieving up to 3x faster rendering speeds. Cache frequently accessed elements locally storing up to 50MB of vector data to reduce server requests on subsequent visits.
Cross-Platform Compatibility
Design 3D elements using standardized SVG specifications ensuring consistent rendering across modern browsers. Test vector animations on both desktop and mobile devices adjusting transform operations for touch interfaces. Support fallback options for older browsers by providing simplified 2.5D representations when full 3D capabilities aren’t available. Implement responsive scaling that automatically adjusts 3D detail based on device capabilities screen size.
Solving Common Technical Challenges
Creating complex 3D elements in vector maps requires careful attention to technical limitations and browser capabilities to ensure optimal performance.
Browser Rendering Issues
Address browser rendering challenges by implementing progressive enhancement techniques for 3D vector elements. Use feature detection to serve appropriate fallbacks in older browsers that lack WebGL support. Optimize SVG rendering through efficient path commands M L C instead of complex curves. Set proper viewport meta tags to prevent scaling issues across different browser engines. Implement requestAnimationFrame for smooth animations to reduce CPU load.
Mobile Device Limitations
Adapt 3D vector elements for mobile devices by reducing polygon counts and simplifying complex geometries. Use device-specific breakpoints to adjust level-of-detail rendering based on screen size and processing power. Implement touch-friendly interaction zones of at least 44×44 pixels for 3D elements. Cache rendered vector tiles to minimize memory usage and improve performance on resource-constrained devices.
Vector Scaling Problems
Prevent vector scaling issues by establishing a consistent coordinate system using viewBox attributes in SVG elements. Set preserveAspectRatio values to maintain proper proportions across different screen sizes. Use relative units like em or percentage values instead of fixed pixel dimensions. Create separate detail levels for 3D elements that automatically switch based on zoom levels to prevent distortion during scaling operations.
Applying 3D Elements Across Different Map Types
Different map types require unique approaches to 3D element integration that enhance their specific functionalities while maintaining clarity and user engagement.
City Navigation Maps
Transform urban navigation maps by incorporating building extrusions with standardized heights between 100-300 pixels based on real-world proportions. Add floating street labels positioned 20-30 pixels above road surfaces and implement subtle drop shadows at 45-degree angles to create depth. Highlight points of interest using 3D markers that rise 50 pixels above building heights while maintaining clean sight lines for street-level navigation. Use isometric perspectives for landmark buildings to serve as visual anchors for orientation.
Topographical Representations
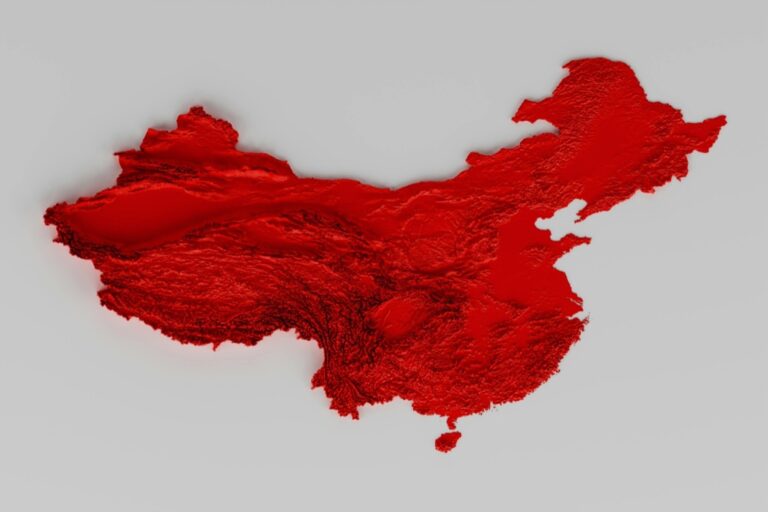
Enhance terrain visualization using stepped elevation layers with 10-pixel increments between contour lines. Apply gradient meshes that transition from light to dark shades to simulate natural lighting on slopes. Implement dynamic height exaggeration ratios between 1.5x and 3x to emphasize relief features while preserving geographic accuracy. Add 3D vegetation symbols using scale-dependent rendering that shows detailed models at zoom levels 15-20 and simplified icons at lower zoom levels.
Indoor Floor Plans
Design multi-level floor plans using z-index layering to separate floors with 15-pixel vertical offsets. Create interactive floor toggles that smoothly transition between levels using 300ms animations. Implement semi-transparent ceiling overlays with 40% opacity to show spatial relationships between floors. Add 3D furniture icons and room markers that maintain consistent orientation regardless of viewing angle using CSS transforms. Highlight emergency exits and staircases with elevated 3D elements that stand out from the base floor plan.
Best Practices for Future Implementation
Emerging Technologies
Adopt WebGL-powered frameworks like Three.js and Mapbox GL JS to enhance 3D vector rendering capabilities. Experiment with WebAssembly for improved performance in complex 3D calculations and real-time updates. Consider implementing augmented reality (AR) integration through frameworks like AR.js to overlay 3D vector elements onto real-world environments. Leverage GPU-accelerated vector processing to handle larger datasets while maintaining smooth interactions.
Industry Standards
Follow the OGC (Open Geospatial Consortium) specifications for 3D vector data formats and interchange. Implement SVG 2.0 standards for consistent rendering across modern browsers and devices. Adopt the GeoJSON-LD specification for linking geographic data with semantic information. Use standardized projection systems like Web Mercator (EPSG:3857) for web mapping applications while maintaining 3D element integrity.
User Experience Guidelines
Design intuitive zoom controls that smoothly transition between 2D and 3D views without disorienting users. Implement responsive 3D elements that automatically adjust detail levels based on device capabilities and viewport size. Provide clear visual feedback for interactive elements through hover states and click responses. Ensure load times remain under 3 seconds by implementing progressive loading strategies for 3D vector elements.
Conclusion
The fusion of 3D elements with flat vector maps represents a significant leap forward in digital cartography. You’ll find these advanced visualization techniques revolutionizing how users interact with and understand spatial data while maintaining the efficiency of vector graphics.
As tools and technologies continue to evolve you’re now equipped to create engaging map experiences that blend functionality with visual appeal. Whether you’re designing for city navigation indoor mapping or topographical representation the strategic implementation of 3D elements will elevate your vector maps to new heights.
Remember that successful 3D vector mapping strikes the perfect balance between visual sophistication and technical performance. By following modern design principles and optimization techniques you’ll create maps that not only look impressive but also deliver seamless user experiences across all platforms.


