9 Cartographic Style Evolutions That Shaped Modern Mapping
Maps have evolved from simple cave drawings to sophisticated digital interfaces reflecting humanity’s enduring need to understand and navigate our world. Throughout history cartographic styles have transformed dramatically adapting to new technologies cultural influences and changing human requirements.
You’ll discover how ancient civilizations used basic symbols and geometric patterns to create rudimentary maps while modern cartographers leverage satellite imagery and complex data visualization techniques to craft detailed interactive experiences that fit in your pocket. Whether you’re a history buff geography enthusiast or simply curious about how we’ve visualized our world throughout time the journey through cartographic evolution reveals fascinating insights about human innovation and our persistent desire to make sense of the spaces we inhabit.
Disclosure: As an Amazon Associate, this site earns from qualifying purchases. Thank you!
Ancient Maps: Early Artistic Representations of Geography
The earliest forms of cartography emerged from humanity’s fundamental need to understand and share geographic knowledge through visual representations.
P.S. check out Udemy’s GIS, Mapping & Remote Sensing courses on sale here…
Clay Tablets and Cave Drawings
Prehistoric humans created the first maps as simple cave paintings dating back to 16500 BCE showcasing hunting grounds valleys & rivers. Mesopotamian civilizations advanced mapping by crafting detailed clay tablet maps between 4000-2000 BCE that featured mountain ranges trade routes & settlements. These early cartographers used basic symbols like triangles for mountains circles for cities & wavy lines for water bodies creating standardized visual elements that influenced mapping for centuries.
Egyptian and Babylonian Mapping Techniques
Egyptians developed sophisticated mapping methods around 1400 BCE using papyrus scrolls & geometric measurements to chart the Nile Valley. They pioneered grid systems & scale concepts to accurately record property boundaries for tax purposes. Babylonian astronomers enhanced these techniques by creating circular world maps with Babylon at the center around 600 BCE introducing mathematical principles to cartography. Their maps combined practical surveying with cosmological beliefs marking the first integration of science & cultural worldviews in mapmaking.
Classical Mediterranean Cartographic Traditions
The Mediterranean region became the epicenter of cartographic innovation during classical antiquity establishing foundational mapping principles still relevant today.
Greek Mathematical Mapping Methods
Greek cartographers revolutionized mapping through mathematical precision between 600-200 BCE. Eratosthenes introduced the first grid system using parallel lines to establish latitude and longitude while calculating Earth’s circumference within 2% accuracy. Ptolemy advanced these methods by developing projection techniques to represent the spherical Earth on flat surfaces using a network of 8000 coordinates. These mathematical innovations enabled Greeks to create detailed maps of the known world incorporating astronomical observations and geometric principles.
Roman Practical Mapping Innovations
Roman cartographers transformed theoretical Greek methods into practical applications between 300 BCE-200 CE. They created detailed road maps called “itineraria” that displayed distances between settlements trade routes and military positions. The Romans introduced standardized symbols for cities bridges and harbors while developing the rectangular survey grid system called “centuriation” for land management. Their most significant contribution the “Tabula Peutingeriana” stretched 22 feet long documenting 70000 miles of roads across the empire.
Medieval European Mapping Styles
Religious World Maps and Biblical Geography
Medieval European cartography centered on religious symbolism through mappae mundi (world maps) created between 600-1500 CE. Monasteries produced T-O maps placing Jerusalem at the center with Asia Europe & Africa arranged in a T shape surrounded by an O-shaped ocean. The Hereford Mappa Mundi (1300 CE) exemplified this style by combining biblical scenes with geographic features across a 5-foot diameter vellum canvas. These maps prioritized theological meaning over geographic accuracy depicting Paradise cities from scripture & religious events alongside basic topographical elements.
Portolan Charts for Maritime Navigation
Mediterranean sailors developed portolan charts in the 13th century as practical navigation tools. These parchment maps featured intersecting compass lines rhumb lines & detailed coastal outlines with ports marked in red & black ink. The Carte Pisane (1290) established key portolan elements including scale bars distance calculations & magnetic declination markers. Sailors used these precise coastal charts with compass readings to plot Mediterranean trade routes through a network of lines radiating from central compass roses.
Renaissance Cartographic Revolution
The Renaissance period marked a transformative era in cartography as European exploration and scientific advancement revolutionized map-making techniques.
Dutch Golden Age Map Design
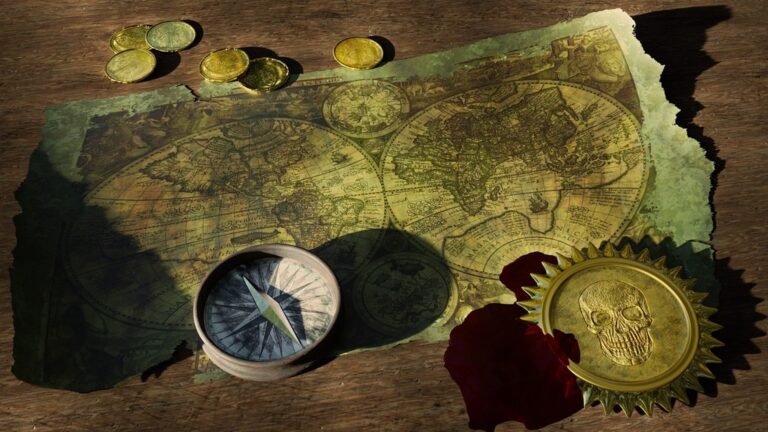
Dutch cartographers dominated 17th-century map production with their distinctive aesthetic and technical innovations. Masters like Willem Blaeu pioneered copper plate engraving techniques that allowed for unprecedented detail in map illustrations. Dutch maps featured elaborate cartouches decorative compass roses and intricate illustrations of ships sea monsters and local scenes. Their maps combined practical navigation tools with artistic elements using vibrant hand-coloring techniques and standardized symbols that influenced cartographic design for centuries.
Introduction of Atlas Collections
The concept of the modern atlas emerged in 1570 when Abraham Ortelius published “Theatrum Orbis Terrarum” the first standardized collection of maps. This revolutionary format featured 53 uniform-sized maps with consistent design elements and detailed source citations. Gerard Mercator further developed the atlas format introducing his projection method in 1569 and publishing his own atlas collection in 1585. These systematic compilations transformed how geographic information was organized and distributed making comprehensive world geography accessible to scholars merchants and explorers.
Explore the world through this meticulously reproduced edition of Theatrum Orbis Terrarum. This classic Latin text offers a fascinating glimpse into historical cartography.
Age of Exploration Mapping Techniques
During the Age of Exploration (15th-17th centuries) cartographic techniques underwent revolutionary changes as European nations sought to map newly discovered territories.
Mercator Projection Development
Gerard Mercator revolutionized navigation in 1569 by creating his cylindrical map projection that preserved angles between meridians and parallels. This groundbreaking technique allowed sailors to plot straight-line courses while maintaining constant compass bearings across oceans. The Mercator projection stretched polar regions but kept shapes accurate near the equator making it ideal for maritime navigation despite its distance distortions.
Decorative Elements and Sea Monsters
Map aesthetics reached new heights during the Age of Exploration as cartographers filled unknown areas with elaborate illustrations. Skilled engravers added intricate compass roses wind heads decorative cartouches and mythical sea creatures to their maps. These artistic elements served dual purposes: filling blank spaces on maps where geographic data was limited and creating valuable art pieces that wealthy patrons would purchase. Famous monsters like the Leviathan and Kraken appeared regularly on maps from 1516 to 1650 marking dangerous or unexplored waters.
Enlightenment Era Scientific Mapping
The Enlightenment period marked a pivotal shift toward data-driven cartography, emphasizing empirical observation and mathematical precision in mapmaking.
Mathematical Precision in Cartography
French cartographer César-François Cassini revolutionized mapping in 1744 by conducting the first large-scale national survey using triangulation methods. The Cassini Maps featured unprecedented accuracy through systematic data collection measuring distances positions and elevations. Cartographers adopted standardized symbols coordinate systems and scale measurements creating a foundation for modern topographic mapping. Jean Picard’s meridian arc measurements enabled precise distance calculations while new surveying instruments improved angular measurements.
Thematic Mapping Emergence
Edmund Halley pioneered thematic mapping in 1701 with his groundbreaking magnetic declination charts of the Atlantic Ocean. Cartographers began creating specialized maps focusing on specific data like population demographics geological formations and weather patterns. William Playfair introduced statistical graphics in 1786 combining quantitative data with spatial representation. These innovations led to choropleth maps isoline mapping and other visualization techniques that transformed how geographic data could be analyzed and presented.
Industrial Revolution Cartographic Advances
Lithographic Printing Innovations
Lithographic printing revolutionized map production in the early 1800s through faster more cost-effective processes. This technique allowed cartographers to create detailed maps by drawing directly on smooth limestone blocks with oil-based ink which could then be mass-produced. By 1850 lithography enabled the printing of multi-colored maps with unprecedented precision featuring railroads industrial centers population data and terrain details at a fraction of traditional engraving costs.
Topographic Mapping Standards
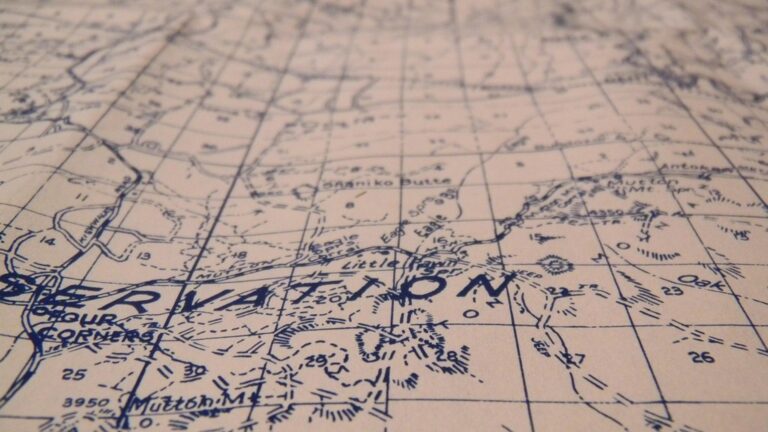
The Industrial Revolution sparked the development of standardized topographic mapping systems to support infrastructure expansion. National mapping agencies like Britain’s Ordnance Survey established uniform symbols contour intervals and scale measurements between 1791-1870. These standards introduced consistent representations for elevation railways canals and urban developments while pioneering the use of benchmark heights spot elevations and detailed relief shading techniques that remain foundational to modern topographic mapping.
Modern Digital Cartography Evolution
GIS and Computer-Generated Maps
Geographic Information Systems (GIS) revolutionized cartography in the 1960s with the launch of CGIS in Canada. This technology enabled digital map creation through layered spatial data analysis creating highly accurate thematic maps. Modern GIS platforms like ESRI’s ArcGIS QGIS and MapInfo now process complex geographic datasets incorporating satellite imagery remote sensing data and 3D terrain modeling. These tools allow cartographers to generate detailed maps with multiple data layers custom symbology and automated updates while maintaining precise geographic coordinates and projections.
Visualize your data effectively with "Thematic Mapping: 101 Inspiring Ways." This guide offers practical techniques for creating compelling thematic maps.
Interactive Web-Based Mapping
Web mapping platforms transformed static maps into dynamic interactive experiences starting with MapQuest in 1996. Google Maps launched in 2005 pioneered user-friendly interfaces and API integration enabling widespread adoption of digital mapping. Modern platforms like Mapbox Leaflet and OpenLayers let users create customizable maps with real-time data updates location-based services and mobile optimization. These tools support features like zoom levels interactive layers custom styling options and integration with various data sources making maps more accessible and functional for everyday users.
Contemporary Cartographic Trends
Modern mapping continues to evolve with technological advances creating new possibilities for spatial data visualization and interaction.
3D Visualization Techniques
3D visualization has transformed cartographic representation through dynamic terrain modeling and interactive cityscapes. Modern software like ArcGIS Pro and CesiumJS enable the creation of photorealistic 3D maps with elevation data building footprints and vegetation layers. You’ll find these tools rendering detailed urban environments with accurate building heights shadow effects and textured surfaces. Digital elevation models (DEMs) combine with satellite imagery to generate immersive flythrough experiences while real-time rendering allows smooth navigation through complex 3D landscapes.
Mobile Mapping Applications
Mobile mapping apps have revolutionized personal navigation by providing location-based services through smartphones and tablets. Apps like Google Maps Waze and OpenStreetMap-based platforms deliver real-time traffic updates point-of-interest information and customizable routing options. These applications leverage GPS technology crowdsourced data and cloud computing to offer features like augmented reality navigation offline maps and voice-guided directions. Location intelligence APIs enable developers to integrate mapping services into custom applications creating specialized solutions for business logistics tourism and social networking.
The Samsung Galaxy S25 Ultra adapts to your needs with intelligent AI assistance. Capture stunning photos and videos with the AI Camera's noise reduction and enjoy effortless switching from your old device.
The Future of Cartographic Design
Today’s cartographic innovations showcase how far we’ve come from simple cave drawings to sophisticated digital mapping systems. The journey through different mapping styles reflects humanity’s remarkable ability to adapt and innovate in representing our world.
Modern technology continues to push the boundaries of what’s possible in cartography. From interactive 3D visualizations to real-time data integration your ability to understand and navigate the world has never been more enhanced.
As we look ahead artificial intelligence and augmented reality promise to revolutionize how you’ll interact with maps. These emerging technologies will transform cartography into an even more immersive and personalized experience shaping the next chapter in this fascinating evolution of human spatial understanding.


