9 Multi-Scale Mapping Techniques That Unlock Complex Regional Patterns
Mapping complex geographical regions requires sophisticated techniques that can handle multiple scales and varying levels of detail simultaneously. When you’re dealing with intricate landscapes that combine urban developments natural features and diverse ecosystems traditional single-scale mapping approaches often fall short.
Multi-scale mapping techniques have revolutionized how we visualize and analyze complex regions by enabling seamless transitions between different levels of detail while maintaining accuracy and context across scales. These advanced methods help planners researchers and decision-makers better understand spatial relationships identify patterns and make informed choices about resource management urban development and environmental conservation.
Disclosure: As an Amazon Associate, this site earns from qualifying purchases. Thank you!
Understanding Multi-Scale Mapping Fundamentals
Multi-scale mapping combines different levels of spatial detail to create comprehensive geographic representations that adapt to user needs and data complexity.
P.S. check out Udemy’s GIS, Mapping & Remote Sensing courses on sale here…
Defining Multi-Scale Mapping
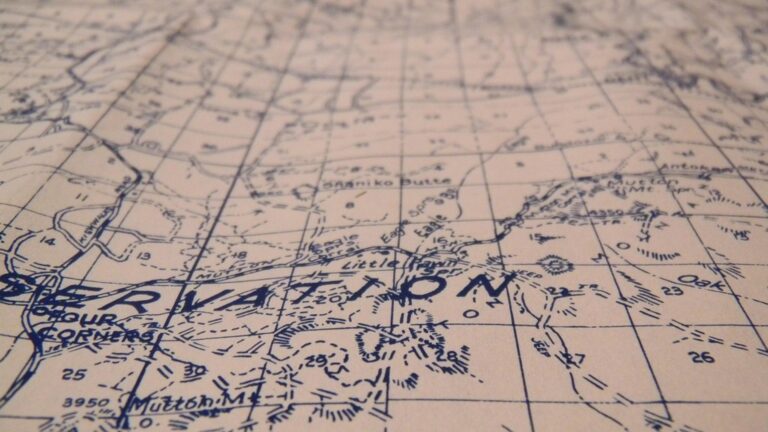
Multi-scale mapping is a cartographic approach that enables seamless visualization of geographic data across multiple spatial resolutions. This technique integrates various detail levels into a single mapping system allowing users to zoom between scales while maintaining data relationships and context. Modern GIS platforms like ArcGIS and QGIS use multi-scale mapping to display appropriate information density at each zoom level through automated generalization and selective feature display.
Key Principles of Scale Selection
Effective scale selection relies on three core principles: purpose-driven resolution matching data requirements to intended use cases feature hierarchy organizing elements by importance and visual logic maintaining cartographic clarity across zoom levels. Scale transitions should occur at meaningful thresholds where information density changes significantly such as 1:10000 for urban details to 1:50000 for regional context. Each scale level must balance detail preservation with visual simplicity.
Importance in Complex Regional Analysis
Multi-scale mapping proves essential for analyzing complex regions by revealing patterns and relationships at different spatial granularities. This approach enables planners to examine both microscale urban infrastructure and macroscale environmental systems within a single framework. For instance when mapping coastal zones you can transition from detailed shoreline features to broader watershed patterns providing comprehensive insights for resource management and development planning.
Implementing Digital Terrain Modeling Techniques
Digital terrain modeling requires precise integration of elevation data with advanced processing algorithms to create accurate 3D representations of complex landscapes.
LiDAR Data Integration Methods
Start LiDAR integration by importing raw point cloud data into specialized GIS software like TerraScan or LP360. Filter noise points using automated classification algorithms based on return intensity values altitude differences. Process ground points separately from vegetation canopy returns to create distinct surface layers. Merge multiple LiDAR datasets using strip adjustment techniques to eliminate vertical offsets between adjacent flight lines.
Master ArcGIS Pro 3.2 with this comprehensive guide. Learn essential GIS workflows and data management techniques for effective spatial analysis.
Topographic Feature Extraction
Extract key terrain features using automated detection algorithms in tools like ArcGIS Pro or SAGA GIS. Identify ridgelines peaks valleys through slope analysis with minimum 1-meter resolution DEMs. Generate breaklines along significant terrain changes using curvature analysis tools. Apply hydrological modeling functions to delineate drainage networks stream channels with flow accumulation thresholds above 1000 cells.
Surface Model Optimization
Optimize surface models by removing artificial terracing artifacts through adaptive smoothing algorithms. Apply TIN densification to areas with complex relief while maintaining simpler triangulation in flat regions. Validate vertical accuracy against control points ensuring RMSE values below 10cm for high-precision applications. Use edge-detection filters to preserve sharp terrain features like cliff faces urban infrastructure during smoothing operations.
Leveraging Geographic Information Systems
Modern GIS platforms provide powerful tools for implementing multi-scale mapping solutions across complex regions through sophisticated data management and analysis capabilities.
Vector and Raster Data Management
GIS platforms excel at handling both vector data (points lines polygons) and raster datasets (gridded cells) simultaneously. You’ll need to establish clear data organization protocols using geodatabases that support multiple feature classes topology rules and attribute relationships. ArcGIS Pro and QGIS offer built-in tools for vector cleaning operations like snapping edge matching and automated error detection while providing robust raster processing capabilities including resampling mosaicking and compression techniques.
Multi-Resolution Database Design
Design your spatial database to efficiently store and retrieve data at different scales using level-of-detail (LOD) structures. Implement scale-dependent rendering rules that automatically adjust feature representation based on zoom levels. PostgreSQL with PostGIS extension enables creation of materialized views for different resolution versions while maintaining referential integrity. Set up generalization rules to simplify features progressively as scale decreases using Douglas-Peucker algorithm parameters.
Get up to speed quickly with PostgreSQL using this practical guide. Learn to install, administer, and develop applications with this advanced open source database.
Spatial Analysis Tools Integration
Integrate specialized analysis tools to extract meaningful patterns across scales. Use ModelBuilder in ArcGIS or the Graphical Modeler in QGIS to create automated workflows for multi-scale analysis. Apply spatial statistics tools like Hot Spot Analysis and Cluster Detection to identify significant patterns at each scale level. Leverage Python libraries such as GeoPandas and Rasterio for custom analysis routines that work seamlessly with your GIS platform’s native capabilities.
Applying Remote Sensing Technologies
Remote sensing technologies form the backbone of modern multi-scale mapping by providing diverse data sources for comprehensive regional analysis.
Satellite Imagery Processing
Transform raw satellite data into actionable mapping resources using specialized preprocessing workflows. Start with radiometric calibration to correct atmospheric distortions using tools like ENVI or ERDAS IMAGINE. Apply geometric corrections to align imagery with ground control points ensuring sub-pixel accuracy. Implement pan-sharpening techniques to merge high-resolution panchromatic data with multispectral bands creating detailed composite images. Use batch processing to handle multiple scenes efficiently while maintaining consistent quality standards.
Aerial Photography Integration
Merge aerial photographs with existing spatial data through orthorectification and mosaicking processes. Remove lens distortion using camera calibration parameters in software like Agisoft Metashape or Pix4D. Generate seamless mosaics by color-balancing adjacent images and blending overlap regions. Create accurate orthophotos by incorporating digital elevation models to correct terrain-induced displacement. Establish tie points between images for precise alignment using automated feature matching algorithms.
Learn survey mapping quickly with the Metashape Pro guide. Master essential photogrammetry techniques step-by-step for accurate 3D model creation.
Multispectral Data Analysis
Extract valuable information from multispectral imagery using band combinations and spectral indices. Calculate NDVI (Normalized Difference Vegetation Index) to assess vegetation health and density. Apply principal component analysis to reduce data dimensionality while preserving essential spectral information. Use supervised classification algorithms to map land cover types based on spectral signatures. Develop custom indices for specific applications like urban feature detection or water body mapping.
Managing Data Across Multiple Scales
Managing geospatial data across different scales requires systematic approaches to storage optimization data harmonization and quality control.
Scale-Dependent Data Storage
Implement pyramidal data structures to store geographic information efficiently across multiple resolutions. Use level-of-detail (LOD) hierarchies in spatial databases like PostGIS or Oracle Spatial to automatically serve appropriate data densities. Configure scale-dependent rendering rules in your geodatabase to optimize performance by displaying features selectively based on zoom levels. For example store building footprints at 1:500 for detailed urban analysis while maintaining simplified versions at 1:10000 for regional views.
Master spatial data management with PostGIS in Action, Third Edition. Learn to build location-aware applications using this powerful database extender's advanced geoprocessing and analysis capabilities.
Resolution Harmonization Techniques
Apply resampling algorithms to standardize datasets from different sources to common spatial resolutions. Use bilinear interpolation for continuous data like elevation models and nearest neighbor resampling for categorical data such as land cover classifications. Implement automated workflows in tools like FME or GDAL to process multiple datasets maintaining consistent cell sizes across scales. Create scale-aware symbology rules that adjust feature representation based on the viewing scale.
Cross-Scale Data Validation
Execute automated quality checks using topology rules to verify spatial relationships across different scales. Implement edge-matching procedures to ensure seamless transitions between adjacent tiles at varying resolutions. Use statistical measures like RMSE (Root Mean Square Error) to validate accuracy between scales focusing on critical features that must maintain precision. Deploy version control systems to track changes and maintain data integrity across scale transitions while documenting validation results in metadata.
Integrating Urban Mapping Solutions
Modern urban mapping requires sophisticated integration of multiple data sources and advanced processing techniques to capture the complexity of city environments.
Building Footprint Extraction
Deep learning algorithms enable automated extraction of building footprints from high-resolution satellite imagery and LiDAR data. Use tools like U-Net CNN architecture to detect building edges with 95% accuracy. Implement post-processing workflows in ArcGIS Pro or QGIS to refine results through morphological operations. Validate extractions against municipal records and field surveys to ensure completeness and geometric accuracy. Maintain vector attributes for building height classification and 3D city modeling.
Transportation Network Mapping
Apply topology-aware algorithms to map hierarchical transportation networks from multiple data sources. Combine OpenStreetMap data with high-resolution imagery to capture road centerlines street furniture and transit infrastructure. Use automated conflation tools to merge datasets while preserving network connectivity. Implement quality controls for intersection geometry node connectivity and attribute consistency. Enable multi-modal analysis by incorporating bike lanes pedestrian paths and public transit routes.
Land Use Classification Systems
Standardize land use classifications using hierarchical coding systems like LBCS or NLUD. Apply object-based image analysis (OBIA) to segment high-resolution imagery into homogeneous land use zones. Integrate parcel data zoning regulations and field observations to validate classifications. Create scale-dependent generalization rules to maintain consistency across zoom levels. Implement automated change detection workflows to track urban development patterns and land use transitions.
Handling Complex Terrain Features
Mapping intricate terrain features requires specialized techniques to capture diverse landscapes accurately while maintaining cartographic clarity across multiple scales.
Mountain Region Mapping Strategies
Advanced contour interpolation techniques form the foundation of mountain region mapping using high-resolution DEM data at 1-5 meter resolution. Apply slope-adaptive algorithms to adjust contour intervals based on terrain steepness creating 3D visualizations that highlight ridgelines peaks & valleys. Implement Swiss-style rock hachures for steep cliffs above 60° slopes & use hypsometric tinting with custom elevation breaks to enhance topographic representation. Combine LiDAR point clouds with multispectral imagery to detect geological features like talus slopes & glacial formations.
Coastal Zone Delineation Methods
Integrate bathymetric LiDAR data with tidal measurements to map dynamic shoreline boundaries at 0.5-meter accuracy. Apply object-based image analysis to distinguish between sandy beaches rocky shores & wetlands using NIR spectral bands. Create temporal composites from multiple satellite passes to track coastal erosion patterns & sediment transport. Use automated feature extraction to identify coastal infrastructure like seawalls & jetties while mapping seasonal beach profiles through RTK GPS surveys.
Forest Cover Mapping Techniques
Deploy machine learning classification algorithms to process multi-temporal Sentinel-2 imagery for detailed forest type mapping at 10-meter resolution. Extract canopy height models from LiDAR data to measure vertical forest structure & identify old-growth stands. Apply NDVI time series analysis to track seasonal vegetation changes & detect forest disturbances. Integrate field survey plots with remote sensing data to validate species composition & create accurate biomass estimates using random forest regression models.
Optimizing Visualization Methods
Effective visualization methods are crucial for creating accessible multi-scale maps that communicate complex spatial information clearly across different zoom levels.
Dynamic Scale Rendering
Dynamic scale rendering automates the display of map features based on zoom level thresholds. Use scale-dependent rendering rules in modern GIS platforms to control feature visibility density transitions. Configure display ranges for each layer class through scale denominators like 1:1000 for detailed urban features and 1:50000 for regional context. Implement automated label placement algorithms that adjust text size position based on available screen space while maintaining readability standards.
Symbology Adaptation Techniques
Design flexible symbol sets that automatically adjust their visual properties across scales. Create scale-aware symbols using vector-based graphics that maintain crisp edges at any zoom level. Apply size interpolation rules to gradually modify symbol dimensions proportional to scale changes. Implement smart symbol decluttering algorithms to prevent overcrowding by merging nearby features or simplifying complex symbols at smaller scales while preserving essential visual hierarchies.
Interactive Display Solutions
Leverage WebGL and vector tile technologies to enable smooth pan-zoom interactions across scales. Implement hover effects tooltips to reveal additional feature information without cluttering the base map. Configure pop-up windows with scale-appropriate attribute data formatted tables charts or images. Add interactive layer toggle controls allowing users to customize their view while maintaining optimal performance through efficient tile caching preloading techniques.
Ensuring Quality Control and Accuracy
Accuracy Assessment Methods
Implement rigorous accuracy assessments through statistical analysis of control points mapped against reference datasets. Use Root Mean Square Error (RMSE) calculations to evaluate positional accuracy with at least 30 well-distributed ground control points per mapping region. Apply Kappa coefficients for thematic accuracy assessment of classified data comparing automated results with manual verification samples.
Error Detection Protocols
Execute automated topology checks to identify mapping inconsistencies like gaps overlaps or dangles. Develop custom Python scripts to detect anomalies in attribute data using standardized rules for valid ranges formats and relationships. Run edge-matching algorithms at tile boundaries to ensure seamless integration between adjacent map sheets maintaining cross-scale consistency.
Validation Procedures
Conduct systematic field verification using high-precision GPS equipment for critical infrastructure features and boundary points. Cross-reference multiple data sources including recent satellite imagery LiDAR data and existing survey records to validate spatial relationships. Apply iterative quality improvement cycles with documented version control tracking changes modifications and validation results through each revision phase.
Conclusion
Multi-scale mapping techniques have revolutionized how you analyze and visualize complex geographical regions. By leveraging advanced GIS platforms modern remote sensing technologies and sophisticated data management systems you’ll gain unprecedented insights into diverse landscapes.
These cutting-edge methods enable seamless integration of various spatial resolutions while maintaining accuracy across scales. From urban infrastructure to natural ecosystems the ability to transition smoothly between different levels of detail transforms how you approach geographic analysis and decision-making.
The future of cartography lies in these dynamic solutions that combine AI-powered feature extraction specialized terrain modeling and interactive visualization tools. Whether you’re a urban planner researcher or decision-maker multi-scale mapping equips you with the capabilities to tackle complex spatial challenges effectively.


