11 Ways Art Meets Science in Modern Maps: A Cartographer’s Guide to Visual Data
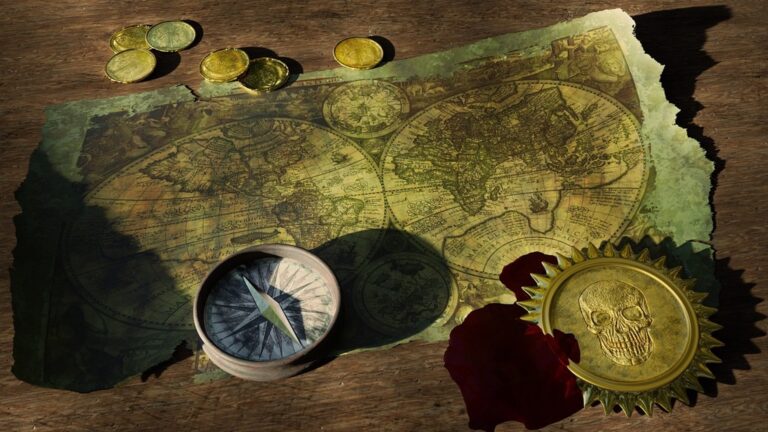
The intricate world of cartography blends scientific precision with artistic expression creating maps that are both technically accurate and visually stunning. From ancient maritime charts adorned with sea monsters to modern digital renderings that pulse with data-driven insights you’ll discover how mapmakers balance form and function to tell compelling stories about our world. Whether you’re a design enthusiast interested in the aesthetic elements of map creation or a data specialist fascinated by geographic information systems this fascinating intersection of art and science transforms raw spatial data into powerful visual narratives that shape how we understand and navigate our planet.
Disclosure: As an Amazon Associate, this site earns from qualifying purchases. Thank you!
Understanding the Historical Evolution of Cartographic Design
The evolution of cartographic design reflects humanity’s growing understanding of geography mathematics and artistic representation across different civilizations and time periods.
Ancient Map-Making Techniques
Early cartographers relied on celestial navigation hand-drawn illustrations and oral traditions to create their maps. Babylonian clay tablets from 2300 BCE featured geometric shapes to represent cities while Chinese silk maps from 200 BCE used grid systems for accurate distance measurements. Egyptian papyrus maps incorporated hieroglyphic symbols to mark important landmarks trade routes and natural resources. These early maps combined practical navigation needs with cultural symbolism using materials like clay papyrus and silk.
The Renaissance Revolution in Mapping
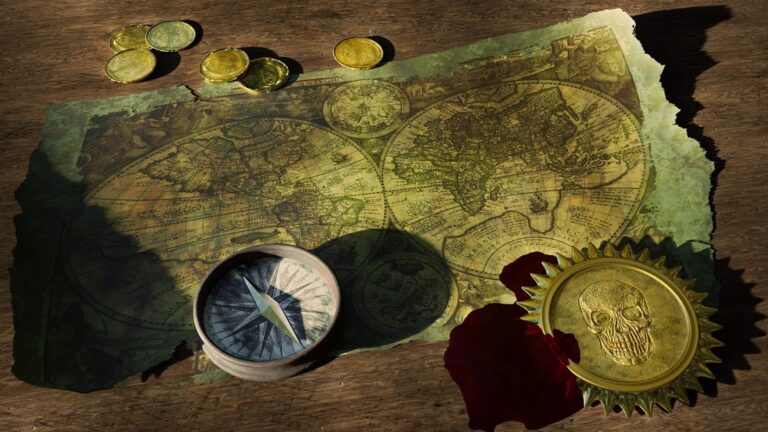
The Renaissance period transformed cartography through three major innovations: perspective drawing mathematical precision and printing technology. Mercator’s 1569 projection system revolutionized maritime navigation while advances in copper plate engraving enabled mass production of detailed maps. Artists like Leonardo da Vinci introduced aerial perspective views creating the first bird’s-eye city maps. Mathematical tools like triangulation grids and compass readings improved spatial accuracy while decorative elements like elaborate compass roses and sea monsters added artistic flair to maps.
Mastering the Scientific Principles Behind Modern Cartography
Geographic Information Systems (GIS)
GIS technology forms the backbone of modern digital cartography by combining spatial data with advanced analysis tools. Industry-standard platforms like ArcGIS and QGIS enable mapmakers to layer multiple datasets including topography demographics and environmental features. These systems process complex spatial relationships through vector and raster data while offering powerful visualization tools that transform raw geographic information into meaningful maps. GIS platforms also support real-time data integration allowing cartographers to create dynamic maps that update automatically.
Satellite Imaging and Remote Sensing
Satellite technology revolutionizes modern mapping through high-resolution imagery and multispectral data collection. Advanced sensors capture Earth’s surface features in unprecedented detail using visible light infrared and radar frequencies. Digital elevation models derived from LiDAR technology provide precise terrain measurements at sub-meter accuracy. These remote sensing tools enable cartographers to map inaccessible areas monitor environmental changes and create detailed land use classifications without ground surveys.
Mathematical Projections and Scale
Map projections translate Earth’s three-dimensional surface onto two-dimensional planes through precise mathematical calculations. Common projections like Mercator Universal Transverse Mercator and Robinson balance different spatial properties including shape area and direction. Digital tools now automate projection selection based on mapping purpose location and scale requirements. Understanding distortion patterns helps cartographers choose appropriate projections that maintain accuracy for specific geographic regions and use cases.
Exploring Artistic Elements in Map Creation
Creating visually compelling maps requires a deep understanding of design principles that enhance both aesthetics and functionality.
Color Theory and Visual Hierarchy
Color selection in cartography follows specific rules to ensure map readability and data interpretation. Use sequential color schemes for showing numerical progression like elevation changes or population density. Apply contrasting colors to distinguish between different map elements such as land and water bodies. Consider color-blind accessibility by avoiding red-green combinations and implementing ColorBrewer palettes. Create visual hierarchy through color intensity where darker shades indicate importance while lighter tones recede into the background.
Typography and Label Placement
Typography choices dramatically impact map legibility and information hierarchy. Select sans-serif fonts like Helvetica or Arial for smaller labels and serif fonts like Times New Roman for larger geographic features. Position labels along natural curves for rivers or roads following the Gestalt principle of continuation. Maintain consistent spacing between labels to prevent overcrowding. Use type size variation to indicate feature importance with larger fonts for major cities and smaller ones for towns.
Escape the ordinary and embrace adventure! *Times New Roman* chronicles one couple's journey of quitting their jobs, decluttering their lives, and moving to Italy. Discover inspiration for your own life change through their experiences.
Symbolism and Icon Design
Map symbols must convey information instantly while maintaining visual harmony. Design icons at multiple sizes to ensure visibility across different zoom levels. Use universal symbols like north arrows and scale bars that follow cartographic conventions. Create custom icons that match your map’s style while remaining recognizable such as simplified buildings for urban areas or trees for forests. Implement consistent stroke weights and shapes across all symbols to maintain design cohesion.
Examining Digital Cartography’s Creative Innovations
Digital cartography has revolutionized map creation by merging cutting-edge technology with artistic expression.
3D Terrain Visualization
Modern 3D terrain visualization tools transform flat topographic data into immersive landscapes using advanced rendering techniques. Programs like ArcGIS Pro and Blender GIS create photorealistic terrain models by combining elevation data satellite imagery and custom textures. These visualizations enhance spatial understanding by showing landforms contours and elevation changes through dynamic lighting and shadow effects. Mapmakers can now generate flythrough animations detailed watershed analyses and interactive terrain exploration tools that bring landscapes to life.
The Magic Bullet quickly chops, blends, and mixes ingredients for easy meals like smoothies and dips. This set includes multiple cups, lids, and a 250W motor base to get you started.
Interactive Mapping Platforms
Web-based mapping platforms have transformed static maps into dynamic user experiences. Tools like Mapbox and Leaflet enable the creation of responsive maps with zoom capabilities layer toggles and clickable elements. Users can customize their viewing experience by filtering data adjusting visual parameters and accessing detailed information through pop-up windows. These platforms support real-time data updates vector tile rendering and mobile-responsive designs that adapt to different screen sizes.
Data-Driven Design Elements
Data-driven design revolutionizes map styling by automatically adjusting visual elements based on underlying data. Smart symbology systems change icon sizes colors and patterns according to data values creating dynamic visual hierarchies. Tools like Unfolded Studio and CARTO enable conditional formatting rule-based styling and automated label placement. These systems maintain visual consistency while representing complex datasets through intelligent design algorithms that respond to data patterns and relationships.
Discovering Contemporary Map Artists and Their Methods
Modern cartographic artists are revolutionizing the field by merging traditional techniques with cutting-edge technology creating unique visualizations of spatial data.
Mixed Media Cartographic Art
Contemporary map artists like Matthew Cusick and Ed Fairburn transform traditional maps into striking artworks through innovative mixed media approaches. Cusick’s intricate collages use vintage maps as paint creating detailed portraits landscapes while Fairburn overlays human faces onto topographic maps. Artists integrate materials like hand-made paper watercolors digital prints and found objects to create multilayered cartographic pieces that challenge conventional mapping boundaries. These works often explore themes of place identity and human connection to geography.
Experimental Mapping Techniques
Pioneering cartographers are developing unconventional methods to represent spatial data through artistic expression. London-based artist Stephen Walter creates detailed hand-drawn maps that combine factual information with personal observations and local folklore. Digital artist Istvan uses generative algorithms to create abstract map representations based on real-time data feeds. These experimental approaches incorporate techniques like sound mapping thermal imaging and augmented reality to push traditional cartographic boundaries while maintaining geographic accuracy.
Digital Map Art Installations
Interactive digital installations are transforming how we experience cartographic art in public spaces. Artists like Refik Anadol create immersive map-based projections that respond to viewer movement and real-time data. The “Deep Learning Cartography” project uses artificial intelligence to generate evolving map visualizations that reflect urban dynamics. These installations often combine multiple projectors motion sensors and custom software to create dynamic spatial experiences that blur the lines between art science and technology.
Balancing Accuracy and Aesthetics in Map Design
Creating effective maps requires careful consideration of both scientific precision and visual appeal to engage users while delivering accurate information.
Maintaining Geographic Precision
Geographic accuracy forms the foundation of reliable cartography through precise coordinate systems and spatial relationships. You’ll need to maintain exact scale ratios datum alignments and projection parameters while working with authoritative data sources. Modern GIS tools like ArcGIS Pro and QGIS offer robust validation features to verify positional accuracy topology rules and attribute integrity during the mapping process.
Incorporating Artistic Expression
Artistic elements transform technical maps into engaging visual narratives through thoughtful design choices. You can enhance your maps using custom color palettes typography hierarchies and symbolic representations that align with your intended message. Design tools like Adobe Illustrator and Mapbox Studio enable you to apply artistic touches while preserving the underlying spatial data integrity through style-based rendering.
Finding the Perfect Middle Ground
Successful map design requires strategic compromises between technical requirements and aesthetic appeal. You’ll achieve this balance by establishing clear design hierarchies prioritizing essential geographic features and applying visual treatments that enhance rather than obstruct data interpretation. Tools like Blender GIS and MapTiler allow you to create visually striking maps that maintain scientific accuracy through controlled generalization and style parameters.
Applying Cartographic Design Principles in Practice
Transforming cartographic theory into practical map creation requires mastering specific tools workflows and quality control processes.
Tools and Software for Modern Mapmaking
Modern cartographers rely on a powerful suite of digital tools to create professional maps. ESRI’s ArcGIS Pro serves as the industry standard for spatial analysis while QGIS provides a robust open-source alternative. Adobe Illustrator excels at finalizing map aesthetics through its vector editing capabilities. For web mapping Mapbox Studio and Leaflet enable interactive visualization while programming languages like Python and R support automated cartographic workflows. Cloud-based platforms like Carto and Tableau simplify data-driven map creation for collaborative projects.
Best Practices for Map Composition
Start your map design by establishing a clear visual hierarchy through thoughtful symbol sizing color selection and typography choices. Position your essential map elements – legend scale bar north arrow and title – in balanced locations that don’t interfere with the main content. Use white space strategically to improve readability and maintain consistent styling across all map elements. Consider your target audience when selecting projection scale and level of detail. Implement visual contrast through color value and size to highlight important features.
Quality Control and Review Process
Implement a systematic quality assurance workflow to validate your map’s accuracy and design effectiveness. Check spatial data for topology errors projection alignment and attribute accuracy using automated validation tools. Review label placement to ensure readability without overlap. Test color schemes for accessibility using tools like ColorBrewer. Gather feedback from both technical experts and target users through structured review sessions. Document all QC steps and maintain version control throughout the editing process using platforms like GitHub or ArcGIS Enterprise.
Looking Ahead: The Future of Artistic Cartography
Emerging Technologies and Techniques
Artificial Intelligence and machine learning are revolutionizing artistic cartography through automated style transfer and pattern recognition. Advanced neural networks now generate custom map styles while maintaining geographic accuracy. Tools like MapBox’s Style Components and ESRI’s ArcGIS API for Python enable real-time data visualization with artistic filters. Augmented reality platforms integrate location-based art directly into mobile map experiences creating immersive geographic storytelling. Quantum computing promises to process complex spatial relationships at unprecedented speeds enabling new forms of artistic expression.
New Frontiers in Map Design
Digital twin technology is expanding cartographic possibilities by creating virtual replicas of real-world environments with artistic overlays. Interactive 3D mapping platforms now support custom shaders and real-time rendering effects that blend traditional cartographic elements with dynamic artistic expressions. Biometric data integration allows maps to respond to viewer emotions creating personalized artistic experiences. Open-source mapping communities are developing collaborative platforms where artists and cartographers can share custom styles and visualization techniques. Environmental sensors feed live data into artistic map displays creating dynamic representations of changing landscapes.
Experience a warm and spicy fragrance from Maison Margiela. This scent blends lemon, pink pepper, and neroli oil with rum, vanilla, and smoky tobacco for a captivating aroma.
Conclusion: The Ongoing Dialogue Between Art and Science in Maps
The dynamic relationship between art and science continues to shape the future of cartography. Modern mapping tools and techniques have opened new possibilities for creating maps that are both scientifically accurate and visually compelling.
As technology evolves you’ll see even more innovative ways to represent spatial data through artistic expression. From AI-powered style transfers to immersive AR experiences these advancements are transforming how you interact with and understand geographic information.
The future of cartography lies in this delicate balance where data accuracy meets creative vision. By embracing both artistic principles and scientific rigor you can create maps that don’t just inform but inspire and engage your audience in meaningful ways.
