9 3D Visualization Techniques That Transform Modern Cartography
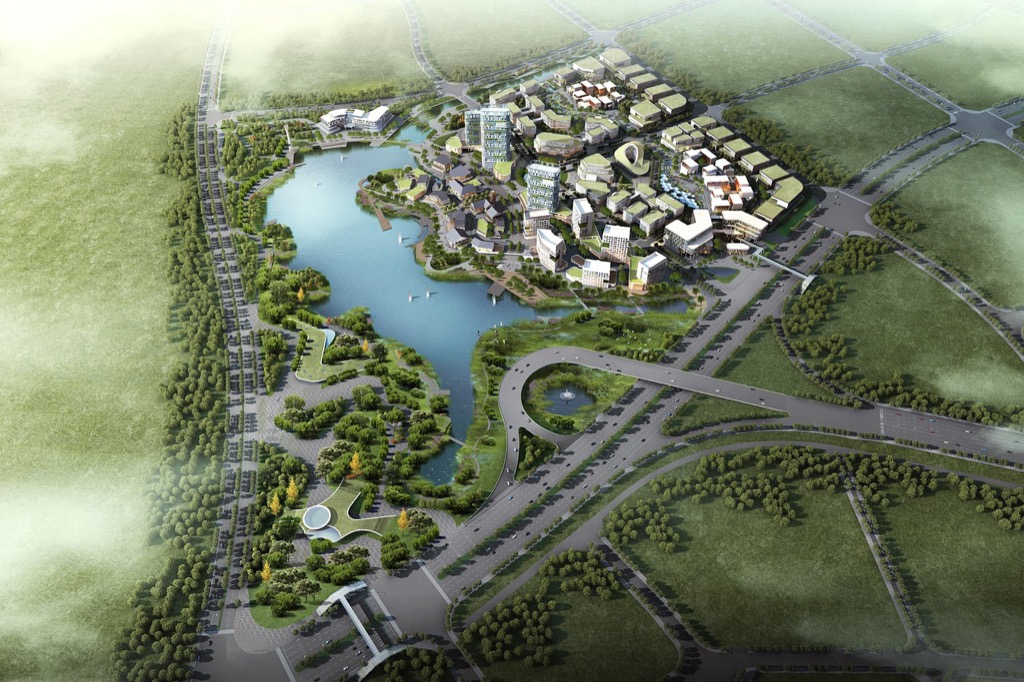
3D visualization has revolutionized modern cartography by transforming flat maps into dynamic three-dimensional landscapes that bring geographic data to life. These advanced techniques allow you to explore terrain features elevation changes and urban landscapes with unprecedented detail and accuracy. Whether you’re a professional cartographer urban planner or GIS specialist learning to harness 3D visualization tools will dramatically enhance your ability to create compelling and informative maps.
The marriage of traditional cartographic principles with cutting-edge 3D technology opens up exciting possibilities for data presentation and spatial analysis. You’ll find that incorporating depth perspective and volumetric data into your maps helps viewers better understand complex geographical relationships and patterns. This innovative approach to mapmaking has become increasingly valuable in fields ranging from environmental science to city planning.
Disclosure: As an Amazon Associate, this site earns from qualifying purchases. Thank you!
Understanding The Basics Of 3D Visualization In Modern Cartography
Evolution From 2D To 3D Mapping
The transition from 2D to 3D mapping started in the 1960s with early computer graphics and gained momentum through technological advancements. Digital Elevation Models (DEMs) revolutionized topographic representation by enabling height data integration into traditional maps. Modern 3D mapping incorporates satellite imagery LiDAR data and photogrammetry to create detailed terrain models. These technologies transform basic contour lines into interactive 3D landscapes allowing users to explore elevation changes building heights and terrain features with unprecedented accuracy.
Key Components Of 3D Cartographic Visualization
3D cartographic visualization relies on four essential elements: terrain modeling vector data integration lighting systems and texture mapping. Terrain modeling uses elevation data to create accurate surface representations while vector layers add roads buildings and infrastructure details. Dynamic lighting systems simulate real-world illumination conditions enhancing depth perception and spatial understanding. Texture mapping applies high-resolution imagery onto 3D models creating photorealistic representations of landscapes and urban environments. These components work together through specialized software like ArcGIS Pro QGIS and CityEngine to produce comprehensive 3D visualizations.
Exploring Essential 3D Visualization Software Tools
Modern 3D cartography relies on powerful software tools that transform raw geographic data into immersive visualizations.
Industry-Standard GIS Applications
ArcGIS Pro leads the industry with its comprehensive 3D mapping capabilities including terrain modeling scene layers symbology controls. QGIS offers robust open-source alternatives through plugins like QGIS2threejs and Qgis2web that enable 3D terrain visualization. Global Mapper combines LiDAR processing DEM creation and 3D visualization in one platform making it ideal for topographic mapping. These applications support common data formats like .las .obj and .fbx while providing extensive analysis tools.
Specialized 3D Mapping Programs
CityEngine excels at procedural modeling for urban environments allowing rapid creation of detailed city models from GIS data. TerrainView specializes in high-resolution terrain visualization with support for real-time rendering and fly-through animations. SketchUp integrates with mapping platforms to create detailed 3D buildings while Cesium offers web-based 3D globe visualization. These specialized tools complement traditional GIS software by focusing on specific visualization needs like urban planning scientific modeling or web deployment.
Master ArcGIS Pro 3.2 with this comprehensive guide. Learn essential GIS workflows and data management techniques for effective spatial analysis.
Implementing Digital Elevation Models (DEM) In Map Creation
Digital Elevation Models form the foundation of modern 3D cartographic visualization by providing precise height data for accurate terrain representation.
Acquiring And Processing DEM Data
- Download high-resolution DEM data from trusted sources like USGS Earth Explorer SRTM or NASA ASTER GDEM
- Process raw DEM files using GIS tools to remove artifacts voids & noise
- Resample data to match your project’s resolution requirements using bilinear or cubic interpolation
- Verify vertical accuracy against ground control points
- Convert between different coordinate systems while preserving elevation values
- Merge multiple DEM tiles for seamless coverage of large areas
- Apply hydro-enforcement to ensure proper water flow representation
- Create slope shade maps to highlight topographic variations
- Apply hill shading with customized light angles & vertical exaggeration
- Generate contour lines at appropriate intervals for your scale
- Use hypsometric tinting to represent elevation zones
- Combine multiple visualization techniques in layer stacks
- Implement dynamic lighting for interactive 3D views
- Add texture mapping for enhanced realism
- Optimize rendering settings for smooth navigation
- Export high-resolution terrain models for print or web display
Mastering Texture Mapping And Surface Rendering
Texture mapping and surface rendering transform basic 3D terrain models into visually rich cartographic representations by adding detail and realism to geographic features.
Adding Realistic Surface Features
Apply textures to enhance terrain visualization through procedural mapping techniques and custom material libraries. Use terrain-specific textures like rock strata grassland and forest cover to match real-world surface characteristics. Implement normal mapping and displacement techniques to add micro-detail for elements like soil texture rock formations and vegetation patterns. Configure ambient occlusion and shadow mapping to create depth and emphasize terrain features without compromising performance.
Incorporating Satellite Imagery
Merge high-resolution satellite imagery with 3D terrain models using UV mapping coordinates for precise alignment. Download orthorectified imagery from providers like Sentinel-2 or USGS Earth Explorer ensuring 1-meter resolution or better for detailed mapping. Process images through color correction and contrast enhancement to maintain visual consistency across different capture dates. Apply mosaicing techniques to blend multiple image tiles seamlessly while maintaining geographic accuracy.
Explore Earth like never before with Spectacular Earth! This book features stunning, high-resolution satellite images from the USGS, revealing our planet's beauty and dynamic landscapes.
Applying Dynamic Lighting And Shadow Effects
Dynamic lighting and shadow effects add crucial depth and realism to 3D cartographic visualizations while helping viewers understand terrain relationships and surface features.
Creating Atmospheric Conditions
Apply atmospheric effects to simulate real-world lighting conditions in your 3D maps. Set up ambient occlusion to darken crevices and valleys while keeping ridges bright. Implement fog density controls to show distance relationships with 20-80% opacity based on viewing distance. Add volumetric lighting effects like sun rays or cloud shadows using tools like ArcGIS Pro’s Atmospheric Effects panel or QGIS Ray Tracing plugin. Adjust atmospheric haze to match time of day with 0-100% intensity scaling.
Enhancing Depth Perception
Configure multiple light sources to create depth-enhancing shadows across your terrain. Position a primary directional light at 315° azimuth and 45° elevation to simulate standard northwest lighting. Add rim lighting at 30% intensity from the opposite direction to highlight terrain edges. Use ambient light at 15-25% strength to prevent completely black shadows. Implement soft shadows with 25-50% blur radius to avoid harsh edges that can distract from map reading. Adjust shadow darkness to 40-60% opacity for optimal terrain legibility.
Integrating Interactive Elements In 3D Maps
User Navigation Controls
Implement intuitive navigation controls to enhance user exploration of 3D maps. Add pan functionality through click-and-drag movements tilt angles from 0 to 90 degrees and zoom levels from street to regional views. Include orbit controls to rotate the map 360 degrees around fixed points keyboard shortcuts for quick navigation and a mini-map for orientation. Configure movement speed settings and boundary constraints to prevent users from getting lost in the 3D space.
Pop-up Information Windows
Design responsive pop-up windows that display contextual data when users click map features. Include dynamic content like location names demographic statistics and environmental data in customizable HTML templates. Add multimedia support for images charts and embedded links while maintaining proper scaling across different zoom levels. Enable filtering options to control which information appears based on feature types and user preferences.
Optimizing 3D Maps For Different Platforms
Effective 3D map optimization requires tailoring your visualization approach to each platform’s unique capabilities and constraints.
Web-Based Visualization Solutions
Create lightweight 3D maps for web browsers using WebGL-based libraries like Mapbox GL JS or Cesium. Implement level-of-detail (LOD) streaming to load high-resolution data only when needed. Optimize texture sizes to under 2048×2048 pixels reduce initial load times. Use vector tiles for dynamic features and compress terrain data using quantized mesh formats. Configure memory-efficient tile caching with a maximum of 50-100MB client-side storage to maintain smooth performance.
Mobile Device Compatibility
Design mobile-optimized 3D maps with simplified geometries and reduced polygon counts. Set texture resolution limits of 1024×1024 pixels maximum for phones and tablets. Implement progressive loading with 3-5 zoom levels to manage memory usage. Use GPU-accelerated rendering through frameworks like Three.js Mobile or Mapbox Mobile. Enable touch-based navigation controls with pinch-to-zoom rotation limited to 15 frames per second for smoother performance.
| Platform Type | Max Texture Size | Recommended LOD Levels | Memory Limit |
|---|---|---|---|
| Web Browser | 2048×2048 px | 4-6 | 100MB |
| Mobile | 1024×1024 px | 3-5 | 50MB |
This durable steel cart supports up to 300 lbs, perfect for transporting equipment. It features adjustable shelves, locking wheels, and a built-in power strip with four outlets for convenient device charging.
Managing Common Challenges In 3D Cartographic Visualization
Creating effective 3D cartographic visualizations requires overcoming several technical and practical hurdles. These challenges demand strategic solutions to maintain both quality and usability.
Dealing With Data Complexity
Large datasets pose significant management challenges in 3D visualization. Handle complex data through strategic decimation techniques that reduce polygon counts while preserving essential features. Implement spatial indexing to organize vector data efficiently and use hierarchical data structures like quadtrees for faster rendering. Apply selective data loading based on view extent and implement progressive mesh loading to handle detailed terrain models without overwhelming system resources.
Balancing Detail And Performance
Optimize your 3D visualizations by implementing level-of-detail (LOD) management systems. Set distance-dependent rendering thresholds where distant objects display simplified geometries while maintaining high detail for nearby features. Use texture atlasing to combine multiple textures into single files reducing draw calls. Configure memory-efficient texture compression formats like DXT or ETC2 to maintain visual quality while reducing resource usage. Monitor frame rates and adjust polygon counts dynamically to ensure smooth navigation.
Future Trends In 3D Cartographic Visualization
The evolution of 3D cartographic visualization continues to accelerate with emerging technologies and innovative applications reshaping how we create and interact with spatial data.
Emerging Technologies
- Real-time Ray Tracing enables photorealistic rendering of terrain features water reflections and atmospheric effects in 3D maps
- Machine Learning Integration automates feature extraction building detection and texture classification from raw spatial data
- Extended Reality (XR) platforms blend virtual and physical environments allowing users to explore 3D maps through AR VR and MR interfaces
- Edge Computing enables faster processing of complex 3D visualizations by distributing computational loads across local devices
- Neural Rendering creates highly detailed textures and realistic environmental effects using AI-powered algorithms
- Digital Twin Mapping creates precise virtual replicas of cities for urban planning disaster response and infrastructure management
- Autonomous Navigation utilizes 3D cartographic data for self-driving vehicles drones and robotics applications
- Climate Change Visualization models environmental changes over time showing sea level rise forest coverage and weather patterns
- Underground Mapping combines subsurface data with above-ground features for utility planning and geological exploration
- Interactive Education transforms geographic learning through immersive 3D environments historical reconstructions and virtual field trips
Best Practices For Effective 3D Map Communication
3D visualization techniques have revolutionized modern cartography by transforming how you create interpret and interact with geographic data. These advanced methods now enable unprecedented levels of detail and engagement through dynamic terrain modeling sophisticated lighting systems and interactive features.
The future of 3D cartographic visualization looks incredibly promising with emerging technologies like real-time ray tracing and neural rendering pushing the boundaries of what’s possible. By implementing the right tools and following optimization best practices you’ll create compelling 3D visualizations that effectively communicate complex spatial information across various platforms.
Whether you’re working on urban planning environmental analysis or educational projects these powerful visualization techniques will continue to evolve making geographic data more accessible and meaningful than ever before.
