8 Ways Art and Data Intersect in Modern Maps: A Visual Revolution
Maps have evolved far beyond simple navigation tools into powerful artistic expressions that blend data with creative vision. When you explore modern cartography you’ll discover an exciting fusion where scientific precision meets aesthetic beauty creating entirely new ways to visualize our world.
From interactive digital landscapes to hand-drawn data visualizations cartographers now combine advanced analytics with artistic principles to transform complex information into captivating visual stories that anyone can understand and appreciate.
Disclosure: As an Amazon Associate, this site earns from qualifying purchases. Thank you!
Understanding the Evolution of Cartographic Art Through History
Ancient Map-Making Techniques
Early civilizations created maps using natural materials like clay tablets bamboo strips and animal skins. Babylonian clay tablets from 2300 BCE featured the first known city plans while Chinese silk maps from 200 BCE displayed intricate topographical details. Egyptian papyrus maps incorporated grid systems mathematical calculations and color coding to represent different land features. These early cartographers combined observational data with artistic elements using symbols pictographs and decorative borders to convey spatial information.
The Renaissance Revolution in Mapping
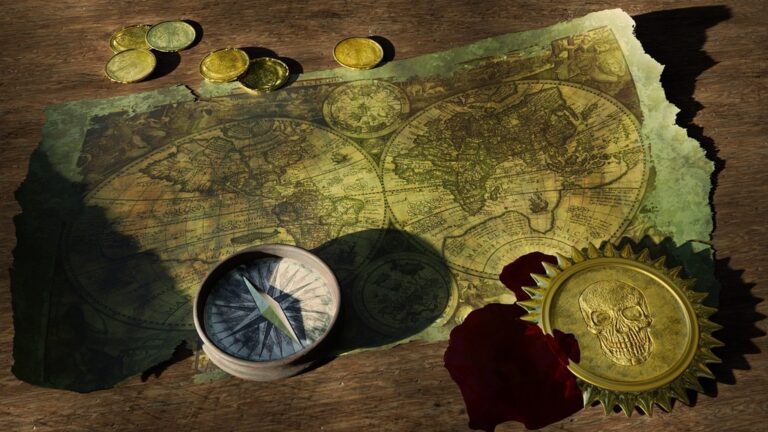
The Renaissance period transformed cartography through mathematical precision and artistic innovation. Mapmakers like Gerard Mercator introduced new projection techniques in the 1500s while combining classical knowledge with empirical observation. Artists incorporated detailed illustrations perspective drawings and ornate compass roses creating maps that were both scientifically accurate and visually stunning. Advanced printing methods enabled wider distribution of maps leading to standardized symbols color schemes and mapping conventions that influenced modern cartographic design.
Discovering Modern Data Visualization in Maps
Modern cartography blends sophisticated data analysis with innovative visualization techniques to create compelling and informative maps.
Digital Mapping Technologies
Digital mapping has revolutionized how we create and interact with geographic data. Tools like Mapbox ArcGIS Online and Google Earth Engine now enable real-time data processing interactive 3D visualization and customizable map styling. These platforms support multiple data layers high-resolution satellite imagery and dynamic updates for applications ranging from urban planning to environmental monitoring. Advanced rendering techniques allow for smooth transitions between zoom levels while maintaining crisp typography and symbol clarity.
Geographic Information Systems (GIS)
GIS technology transforms raw geographic data into actionable insights through powerful spatial analysis tools. Modern GIS platforms like QGIS and ArcGIS Pro integrate machine learning algorithms vector analysis and raster processing capabilities. Users can perform complex spatial queries analyze patterns and create stunning visualizations using tools like heatmaps choropleth mapping and 3D terrain modeling. These systems also support automation through Python scripting allowing for efficient processing of large datasets and customized mapping workflows.
Exploring Aesthetic Elements in Data-Driven Maps
Transform complex data into visually compelling maps by mastering key design elements that enhance both functionality and appeal.
Color Theory and Visual Hierarchy
Color selection drives effective data visualization in maps. Use sequential color schemes for numerical data like population density or temperature gradients. Apply diverging palettes to highlight contrasting data points such as elevation changes or economic indicators. Implement ColorBrewer-designed palettes to ensure accessibility for colorblind users. Create visual hierarchy through strategic color intensity variations letting primary data stand out while keeping supporting elements subtle. Consider cultural color associations when designing maps for specific regions or audiences.
Typography and Symbol Design
Select fonts that maintain legibility across multiple zoom levels and screen resolutions. Use sans-serif typefaces like Roboto or Open Sans for digital maps and clear hierarchy through font weights. Design symbols with consistent stroke weights and simplified shapes that scale effectively. Implement point symbols at 16-24 pixels for optimal mobile viewing. Create custom icons using vector graphics to maintain crispness across devices. Match symbol complexity to your map’s scale ensuring features remain distinguishable at all zoom levels.
Pattern and Texture Implementation
Apply patterns strategically to differentiate between area features without overwhelming the viewer. Use texture density to represent data intensity in choropleth maps. Create custom patterns for specialized datasets like land use categories or geological formations. Implement subtle background textures to add depth while maintaining focus on primary data layers. Consider file size implications when using textured fills in web-based maps. Balance pattern complexity with map legibility ensuring textures enhance rather than obscure data representation.
Mastering the Balance Between Accuracy and Artistry
Scientific Precision in Modern Cartography
Professional cartography requires rigorous attention to spatial data accuracy and projection systems. Modern mapping tools like ArcGIS Pro and QGIS provide advanced geodetic frameworks that ensure precise coordinate systems and datum transformations. You’ll find built-in validation tools that verify topological relationships while Python libraries like GeoPandas enable automated quality checks. Industry standards like the National Map Accuracy Standards (NMAS) guide the creation of maps with specific tolerances for feature placement ensuring consistent reliability across different scales.
Creative Expression in Map Design
Map design flourishes through creative techniques that enhance data communication without compromising accuracy. You can utilize custom symbology libraries in tools like Mapbox Studio to develop unique visual hierarchies. Advanced visualization methods include hillshade effects with varying opacity levels terrain curvature coloring and custom markers that reflect local culture or context. Design frameworks like ColorBrewer help select aesthetically pleasing yet colorblind-friendly palettes while typography tools in Adobe Illustrator enable custom labeling that maintains readability across different zoom levels.
Examining Contemporary Digital Cartography Tools
Interactive Mapping Platforms
Modern mapping tools empower you to create dynamic visualizations with real-time data integration. Mapbox Studio offers customizable vector tiles and style editors for creating responsive web maps with custom datasets. ArcGIS Online provides cloud-based mapping with extensive data libraries sharing capabilities and collaborative features. OpenLayers enables you to build interactive web maps using open-source JavaScript libraries with support for multiple data formats including GeoJSON WMS and vector tiles. These platforms integrate seamlessly with APIs databases and third-party services for enhanced functionality.
3D Visualization Software
Advanced 3D mapping software transforms traditional cartography into immersive spatial experiences. CesiumJS specializes in time-dynamic 3D globe visualization supporting terrain mapping building models and atmospheric effects. Unity3D’s geospatial tools enable creation of detailed urban landscapes with realistic lighting and textures. QGIS 3D features provide terrain analysis capabilities digital elevation modeling and 3D symbol rendering. These tools support various data formats including LiDAR point clouds digital elevation models and 3D building datasets allowing you to create compelling virtual environments for urban planning environmental modeling and interactive storytelling.
Understanding the Role of Data Analytics in Map Creation
Modern cartography relies heavily on data analytics to transform raw geographic information into meaningful visual narratives. Data analytics enables mapmakers to process complex spatial relationships and create more accurate targeted visualizations.
Big Data Integration
Data analytics revolutionizes map creation by processing massive datasets from multiple sources. Geographic Information Systems (GIS) now handle satellite imagery LiDAR point clouds and real-time sensor data through platforms like Google Earth Engine and ArcGIS Enterprise. These tools enable automatic feature extraction pattern recognition and spatial trend analysis across terabytes of information. Modern mapping platforms integrate data streams from IoT devices social media feeds and environmental sensors to create dynamic living maps that update in real-time.
Statistical Mapping Techniques
Advanced statistical methods enhance map accuracy and insight delivery. Techniques like kernel density estimation create sophisticated heat maps while spatial autocorrelation identifies geographic patterns and clusters. Mapmakers use regression analysis to model relationships between variables and predict spatial trends. Tools such as GeoDa and R’s spatial packages provide robust statistical frameworks for analyzing geographic data. These methods transform raw coordinates and attributes into meaningful visualizations that reveal hidden spatial patterns and relationships.
Implementing Artistic Principles in Geographic Data
Composition and Layout
Apply fundamental design principles to organize map elements through visual hierarchy and balanced spacing. Position key components like legends titles and scale bars using the rule of thirds to create focal points. Arrange data layers with contrasting colors textures and patterns to distinguish between geographic features. Consider white space as an active design element to prevent cluttered displays and guide viewers through complex spatial information. Use grid systems to maintain consistent alignment across multiple map elements.
Visual Storytelling Through Maps
Transform raw geographic data into compelling narratives through strategic visualization choices. Layer your data to reveal spatial patterns relationships and trends that support your map’s core message. Implement progressive disclosure techniques showing relevant details at appropriate zoom levels. Use visual variables like size color and shape to encode quantitative and qualitative data effectively. Create thematic maps that highlight specific phenomena through carefully selected classification methods and symbology. Incorporate annotations callouts and supplementary graphics to provide context and guide interpretation.
Exploring Future Trends in Artistic Cartography
AI-Generated Map Design
AI-powered tools now revolutionize cartographic design through sophisticated algorithms that blend artistic styles with geographic data. Platforms like StyleGAN create unique map aesthetics by analyzing thousands of historical maps while maintaining spatial accuracy. Machine learning models assist in automated symbol placement map generalization and custom style transfers transforming basic geographic data into visually striking compositions. Neural networks also enable real-time style adjustments adaptive color schemes and intelligent label positioning making artistic map creation more accessible and efficient.
Augmented Reality Mapping
AR technology transforms traditional cartography into interactive spatial experiences by overlaying digital art and data onto physical environments. Mobile AR apps now render real-time 3D terrain visualizations custom map layers and location-based artistic elements through smartphone cameras. Platforms like Mapbox AR and ESRI’s ArcGIS Runtime enable developers to create immersive mapping experiences that blend real-world navigation with digital art installations. These tools support gesture-based interactions dynamic data visualization and collaborative mapping features revolutionizing how we interact with geographic information.
Creating Impact Through Data-Driven Map Art
Data-driven map art transforms complex information into visually compelling narratives that drive social change and cultural understanding.
Social and Environmental Applications
Map art amplifies environmental and social justice initiatives through powerful data visualization. Geographic heat maps reveal urban food deserts while choropleth techniques highlight income inequality across neighborhoods. Projects like “Climate Stripes” by Ed Hawkins use color-coded strips to show temperature changes over centuries making climate data instantly accessible. Organizations like GreenMap use custom icons and interactive layers to track sustainable initiatives showing how artistic mapping catalyzes community action.
Cultural Mapping Projects
Indigenous mapping projects preserve cultural heritage by combining traditional knowledge with modern GIS techniques. The Native Land Digital platform uses crowd-sourced data to create artistic territory visualizations while documenting language groups and tribal histories. Urban culture maps like Rebecca Solnit’s “Infinite City” blend demographic data with hand-drawn illustrations to reveal hidden neighborhood stories. These projects use specialized symbology color schemes and typography to represent cultural identities while maintaining data accuracy.
Conclusion
The fusion of art and data in modern cartography opens up exciting possibilities for creating impactful visual narratives. Advanced tools and technologies now enable you to blend scientific precision with artistic expression while maintaining data integrity. From AI-powered design to augmented reality mapping the field continues to evolve at a rapid pace.
Today’s cartographic landscape empowers you to tell compelling stories through maps that are both informative and visually striking. Whether you’re visualizing environmental changes creating cultural heritage maps or designing interactive urban experiences you’ll find endless opportunities to merge creativity with data-driven insights.
The future of cartography promises even more innovative ways to represent our world through the perfect balance of art and analytics.


