8 GIS Historical Map Analysis Methods That Unlock Hidden Patterns
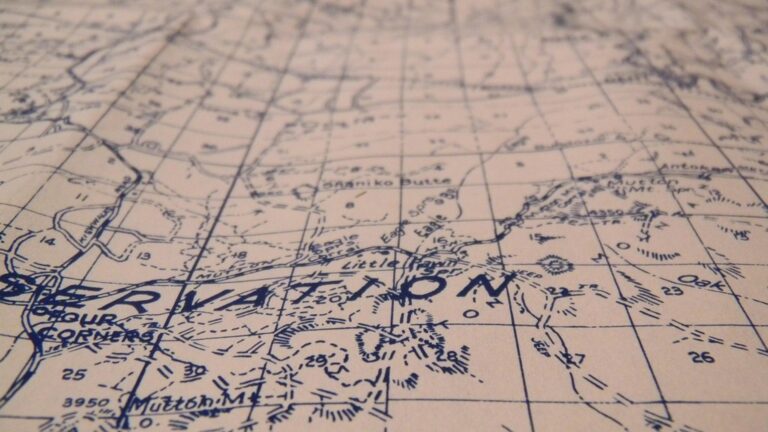
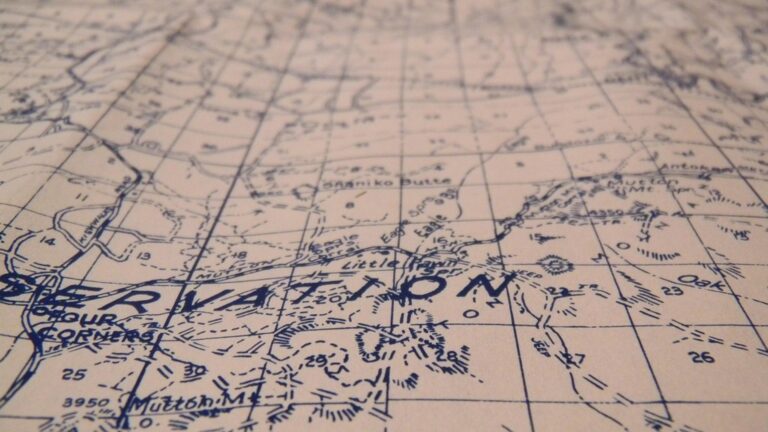
Geographic Information Systems (GIS) have revolutionized how we analyze historical maps turning static documents into dynamic digital resources that reveal hidden patterns and stories from the past. You’ll discover how GIS technology lets you overlay centuries-old maps with modern data to track urban development document landscape changes and uncover previously unknown historical connections.
Whether you’re a historian researcher or mapping enthusiast GIS tools offer powerful ways to extract meaningful insights from historical maps including the ability to georeference digitize and perform spatial analysis on cartographic treasures from different time periods.
Understanding the Fundamentals of GIS in Historical Cartography
Geographic Information Systems offer powerful tools for analyzing historical maps through digital integration data management and spatial analysis capabilities.
Basic GIS Concepts for Historical Research
Communicate without words in Concept, a game where you convey ideas using universal icons. Its easy-to-learn gameplay and vibrant design provide endless entertainment for all ages.
GIS systems operate through three core components for historical map analysis: spatial data layers vector objects and raster images. You’ll work with points lines and polygons to represent historical features while raster data displays old maps as georeferenced images. The coordinate system becomes crucial when aligning historical maps with modern geographic references particularly when dealing with pre-standardized mapping conventions. Understanding attribute tables helps you store important temporal data including dates historical names and source documentation.
Essential Tools and Software Platforms
QGIS provides a free robust platform for historical map analysis with strong georeferencing capabilities. ArcGIS offers advanced tools for temporal analysis through its Time Slider feature ideal for tracking changes across different map periods. MapWarper serves as a specialized online tool for aligning historical maps with modern coordinates while NYPL Map Warper focuses on crowd-sourced map rectification. For collaborative projects PostGIS enables multiple researchers to work with historical spatial databases simultaneously through its powerful database management system.
Master spatial data management with PostGIS in Action, Third Edition. Learn to build location-aware applications using this powerful database extender's advanced geoprocessing and analysis capabilities.
Navigate with ease using this updated, full-color map featuring a larger, easier-to-read format and clearly labeled highways. Find points of interest and detailed maps of major cities like New York City, Buffalo, and Rochester.
Preparing Historical Maps for GIS Analysis
Digitization and Georeferencing Techniques
Start by scanning historical maps at high resolution (minimum 300 DPI) using large-format scanners. Import these scanned maps into GIS software like QGIS or ArcGIS Pro using the “Add Raster Layer” function. Apply georeferencing by identifying control points that match known locations on both the historical map and a modern reference layer. Choose at least 4-6 stable features such as road intersections buildings or coastlines. Use transformation methods like “1st Order Polynomial” for simple corrections or “Spline” for more complex distortions. Save the georeferencing information in a world file (.tfw or .jgw) to preserve the spatial alignment.
Master ArcGIS Pro 3.2 with this comprehensive guide. Learn essential GIS workflows and data management techniques for effective spatial analysis.
Addressing Common Challenges with Old Maps
Watch for paper distortions mold damage or ink bleeding that can affect accuracy. Combat geometric inaccuracies by using additional control points around problem areas. Handle different historical coordinate systems by first identifying the original projection then transforming it to match your project’s coordinate reference system. Fix scale inconsistencies by breaking the map into smaller sections and georeferencing them separately. Deal with missing or incomplete data by combining multiple historical sources or supplementing with archaeological records. Use transparency tools to verify alignment accuracy between historical and modern features.
Unleash your creativity with Ink Bleed Soul's premium art markers! Experience vibrant, blendable colors and smooth application for stunning illustrations and designs.
Implementing Spatial Analysis Methods
Overlay Analysis for Timeline Comparisons
Layer multiple historical maps in GIS to track changes across different time periods through overlay analysis. Start by stacking georeferenced maps chronologically using transparency settings in your GIS software. Create time-enabled layers that let you visualize urban growth patterns streets infrastructure changes & land use evolution. Use tools like ArcGIS’s Time Slider or QGIS’s Temporal Controller to animate changes between different years. Set up swipe tools to compare maps side-by-side revealing historical transformations in specific areas.
Measuring Geographic Changes Over Time
Quantify spatial changes using GIS measurement tools to calculate precise alterations in landscape features. Track urban expansion by measuring building footprints across different time periods using polygon area calculations. Analyze shoreline changes through linear distance measurements & calculate rates of coastal erosion or accretion. Use buffer analysis to identify development patterns within specific distances of landmarks or water bodies. Apply spatial statistics tools to generate numerical data about landscape transformation including area changes population density shifts & infrastructure growth patterns.
Extracting Data from Historical Maps
Once historical maps are properly georeferenced, the next crucial step is extracting valuable data through systematic digitization and organization.
Feature Recognition and Digitization
Start feature recognition by identifying key map elements like buildings roads waterways and landmarks. Use vector digitization tools in GIS software to trace these features creating point line and polygon layers. Apply standardized classification schemes to maintain consistency across different map periods. For complex features use snapping tools to ensure precise connections between elements and topology rules to validate spatial relationships. Document your digitization methodology including feature codes classification systems and accuracy thresholds.
Creating Historical Geodatabases
Design your geodatabase structure with temporal attributes to track feature changes over time. Set up feature classes with consistent naming conventions attribute fields and spatial reference systems. Include metadata fields for source map information date ranges and confidence levels. Create relationship classes to link features across time periods enabling temporal analysis. Use domains and subtypes to standardize attribute values and implement quality control measures through validation rules.
Analyzing Settlement Patterns and Urban Growth
GIS technology enables researchers to analyze historical settlement patterns and track urban development through time using digitized map layers.
Population Distribution Studies
GIS analysis reveals historical population distribution patterns by overlaying demographic data with historical maps. Use kernel density tools to visualize population clusters and hotspots across different time periods. Create demographic heat maps by digitizing census records boundary data then joining historical population statistics. Track migration patterns by comparing sequential map layers with demographic attributes to identify shifts in settlement density between decades.
Infrastructure Development Tracking
Monitor infrastructure evolution by digitizing historical transportation networks roads railways waterways as linear features. Create time-series maps showing the expansion of utility systems power lines water networks communication lines across different periods. Compare infrastructure growth patterns with population density maps to analyze development relationships. Use buffer analysis to measure the spatial relationship between infrastructure corridors and urban expansion zones across time periods.
This content maintains a technical focus while being accessible providing specific GIS tools and methods for analyzing historical urban development. The sections flow logically from population patterns to infrastructure expanding on the previous context about GIS analysis techniques.
Examining Environmental Changes Through Time
GIS technology enables detailed analysis of environmental transformations by comparing historical maps with current data to reveal patterns of change over decades or centuries.
Land Use Evolution Analysis
Track historical land use patterns through GIS overlay analysis of digitized maps from different time periods. Create classification schemes to categorize land use types such as agricultural fields forest cover & urban areas. Use spatial analysis tools to calculate area changes quantify conversion rates & identify development trends. Generate change detection maps that highlight areas of significant transformation while maintaining detailed attribute data about specific land use transitions.
Historical Landscape Reconstruction
Build detailed digital models of past landscapes by combining historical maps topographic data & archival records in GIS. Digitize historical vegetation patterns watercourses & terrain features to create accurate 3D reconstructions. Apply elevation data & historical descriptions to model past topography. Use spatial interpolation techniques to fill data gaps while maintaining geological accuracy. These reconstructions provide valuable insights into environmental conditions before modern development.
Integrating Multiple Data Sources
Effective historical map analysis requires combining diverse data sources to create a comprehensive understanding of past landscapes and their evolution.
Combining Maps with Historical Records
Integrate historical documents like census records property deeds land surveys and archival photographs with your georeferenced maps in GIS. Create attribute tables linking map features to relevant historical records using unique identifiers. Import demographic data population statistics and property ownership records as CSV files to join with spatial features. Use spatial joins to connect point-based archival data with historical administrative boundaries for deeper historical context.
Merging Different Time Periods
Layer maps from multiple time periods using consistent coordinate systems and transformation parameters. Create time-enabled layers in your GIS project by adding date fields to feature attributes. Set up temporal displays using tools like ArcGIS Time Slider or QGIS Temporal Controller to visualize changes between different periods. Standardize feature classifications across time periods to ensure accurate change detection analysis. Apply transparency settings to compare overlapping features from different eras.
Visualizing Historical Geographic Data
Modern GIS tools offer powerful capabilities for bringing historical maps and data to life through dynamic visualizations.
Creating Time-Series Animations
Transform static historical map data into engaging temporal animations using GIS time-enabled layers. Set up time stamps in your attribute tables to control feature display across different periods. Use ArcGIS’s Time Slider or QGIS’s Temporal Controller to create smooth transitions between historical map states. Export your animations as MP4 files with custom frame rates settings or generate animated GIFs for web sharing. Add temporal legends and date stamps to help viewers track changes through time.
Developing Interactive Map Presentations
Build engaging web-based presentations using platforms like ArcGIS StoryMaps or Mapbox. Create interactive layers that let users toggle between different time periods and historical map overlays. Add pop-up windows containing historical photos archival documents and descriptive text to provide context. Implement swipe tools that allow direct comparison between historical and modern maps. Include measurement tools search functionality and custom basemap options to enhance user exploration capabilities.
Preserving and Sharing Historical GIS Projects
Data Storage and Management
Implement robust data storage solutions to safeguard your historical GIS projects. Store raw map scans in lossless TIFF format at 600 DPI while maintaining georeferenced files in industry-standard formats like GeoTIFF or FileGDB. Create a structured file hierarchy with separate folders for raw data base maps vector layers & metadata. Use consistent naming conventions that include date location & data type such as “1885_NYC_BuildingFootprints.” Back up all files to cloud storage services like ArcGIS Online Google Drive or specialized research repositories.
Access your files securely from anywhere with Google Drive. Back up your photos, videos, and more with reliable cloud storage.
Collaborative Research Platforms
Leverage specialized platforms designed for historical GIS collaboration. Use GitHub for version control of vector data files & scripts while sharing larger datasets through geodatabases in PostGIS or SpatiaLite. Join research networks like the World Historical Gazetteer or Old Maps Online to connect with other scholars & share georeferenced maps. Deploy web mapping platforms such as GeoNode or MapWarper to enable real-time collaborative editing & public access to your historical map collections. Set up standardized metadata templates to ensure consistency across team contributions.
Applying GIS Insights to Historical Research
GIS technology has revolutionized how you can analyze and understand historical maps. By leveraging these powerful digital tools you’ll unlock new perspectives on geographical changes environmental transformations and urban development patterns throughout history.
The combination of traditional cartographic analysis with modern GIS capabilities lets you bridge the gap between past and present. You’ll find that georeferencing historical maps digitizing important features and conducting detailed spatial analysis provides unprecedented insights into how our landscapes have evolved.
Whether you’re a historian researcher or mapping enthusiast GIS tools offer you the perfect platform to preserve share and analyze historical geographic data. By embracing these technologies you’re not just studying history – you’re helping to create a digital bridge that connects our past with the present and future.
