11 Unique Approaches to Historical Map Interpretation That Reveal Hidden Stories
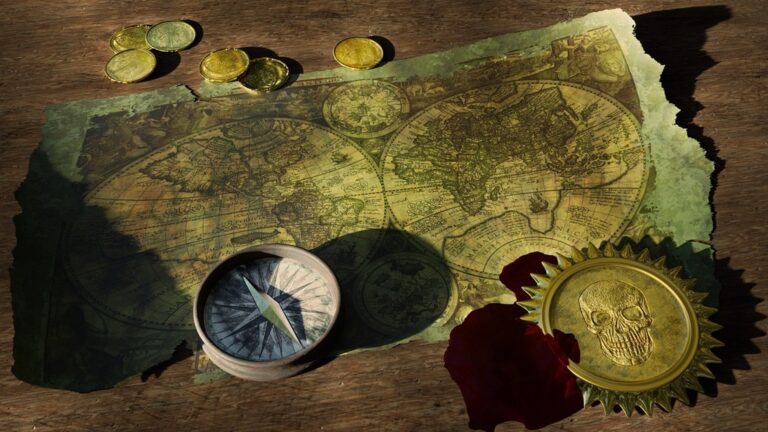
Historical maps hold secrets far beyond their faded lines and weathered edges – they’re windows into how our ancestors viewed and shaped their world. When you explore these cartographic treasures with fresh eyes you’ll discover hidden stories about power social dynamics and technological limitations that shaped how civilizations mapped their surroundings.
Looking beyond traditional geographic analysis you can uncover fascinating insights by examining historical maps through the lenses of art anthropology and digital humanities. Modern technology and interdisciplinary approaches have revolutionized how we interpret these valuable artifacts letting us piece together compelling narratives about trade routes cultural exchanges and historical perspectives that weren’t obvious to previous generations.
Understanding Historical Maps Through Multiple Cultural Perspectives
Historical maps reflect diverse worldviews shaped by cultural beliefs values and societal structures of their creators.
Indigenous Knowledge Systems
Indigenous maps often integrate spiritual connections environmental wisdom and oral traditions into their cartographic representations. These maps frequently use natural landmarks sacred sites and seasonal patterns as reference points. Native American tribes like the Hopi created maps showing ceremonial routes water sources and agricultural zones that connect physical geography with cultural practices. Their mapping systems emphasize relationships between land community and time through symbolic representations rather than exact measurements.
Colonial Viewpoints and Biases
Colonial maps reveal power dynamics through their emphasis on resource extraction administrative boundaries and strategic military positions. European cartographers often distorted or omitted indigenous settlements while highlighting areas of economic interest like mining regions or plantation zones. British imperial maps of India for example prioritized railway routes commercial ports and administrative centers while minimizing local cultural landmarks. These maps served as tools of control shaping territorial claims and influencing modern political boundaries.
Analyzing Map Symbolism and Artistic Elements
Decoding Period-Specific Iconography
Map symbols reveal crucial cultural insights from different historical periods. Renaissance maps feature celestial elements like wind heads cherubs to showcase divine authority. Medieval Islamic cartography uses geometric patterns geometric patterns while avoiding human figures. Chinese maps incorporate feng shui principles through symbolic mountains rivers dragons. Japanese Edo-period maps display social hierarchy through building sizes color schemes. Understanding these period-specific symbols helps decode power structures technological capabilities cultural values of different civilizations.
Interpreting Decorative Features
Decorative elements in historical maps serve both aesthetic practical purposes. Sea monsters on 16th-century European maps mark dangerous waters unknown territories. Elaborate compass roses indicate navigation technology sophistication trade route importance. Border illustrations often contain political messages through coat of arms national emblems military symbols. Color choices reflect available pigments mineral sources with expensive colors like ultramarine showing map patron wealth status. These artistic elements transform maps from mere geographical tools into cultural artifacts that reveal societal priorities technological limitations artistic traditions.
Exploring Digital Tools for Map Analysis
Modern technology has revolutionized how we analyze and interpret historical maps, offering powerful tools to uncover hidden details and patterns.
3D Visualization Techniques
Transform flat historical maps into immersive 3D models using photogrammetry and depth mapping software like Agisoft Metashape or RealityCapture. These tools help reveal topographical features ancient cartographers tried to represent through shading and symbols. Advanced rendering techniques highlight elevation patterns medieval mapmakers documented through artistic representations. You’ll discover previously hidden details in relief maps by adjusting light sources virtual angles and surface textures.
Geographic Information Systems (GIS)
Leverage GIS platforms like QGIS or ArcGIS to overlay historical maps with modern geographical data for precise analysis. These tools enable you to georeference old maps to current coordinates revealing how past cartographers documented spatial relationships. Import multiple map layers to track changes in landscapes settlements and boundaries across different time periods. You can extract quantitative data about historical trade routes administrative regions and population centers through spatial analysis tools.
Investigating Social Networks Through Historical Maps
Trade Routes and Commercial Relationships
Historical maps reveal intricate networks of trade relationships through carefully marked routes pathways and commercial hubs. Ancient silk road maps showcase merchant networks connecting Asia Europe and Africa with symbols indicating caravanserais trading posts and market cities. Maritime trade maps from the Dutch East India Company highlight shipping routes vessel types and port hierarchies documenting the flow of spices textiles and precious metals. These maps often include detailed annotations about travel times seasonal weather patterns and diplomatic relationships between trading partners providing insights into historical economic systems.
Power Dynamics and Political Boundaries
Maps serve as powerful tools for understanding historical power structures and territorial control. Colonial-era maps demonstrate shifting political boundaries through color coding administrative districts and strategic military positions. You’ll find evidence of power dynamics in how mapmakers depicted disputed territories contested resources and military installations. For example 18th-century British maps of North America show competing territorial claims between European powers while minimizing Native American presence. The careful placement of fortifications trading posts and administrative centers reveals patterns of colonial expansion and governance systems.
Examining Environmental Changes Through Map Comparison
Historical Landscape Transformation
Geographic comparisons of historical maps reveal dramatic changes in landscape features over time. High-resolution scans of 18th-century survey maps show original coastlines wetlands & forest coverage that differ significantly from modern landscapes. For example Old Dutch maps of Manhattan from 1660 display extensive marshlands that were later filled to create today’s Financial District. European agricultural maps from the 1800s document the conversion of ancient woodlands to farmland marking shifting land use patterns that shaped modern ecosystems.
Climate Pattern Documentation
Historical maps serve as vital records of past climate conditions & weather patterns. Maritime charts from the 15th-19th centuries track ice coverage in polar regions providing crucial data about historical climate variations. Japanese maps from the Edo period (1603-1867) detail seasonal flooding patterns along major rivers while Chinese agricultural maps document rainfall patterns through detailed notations about crop cycles. Modern researchers overlay these historical climate indicators with current data to understand long-term environmental trends & validate climate models.
| Time Period | Map Type | Climate Information |
|---|---|---|
| 15th-19th C | Maritime Charts | Arctic ice extent |
| 1603-1867 | Japanese Maps | River flooding cycles |
| 1700-1900 | Chinese Maps | Agricultural rainfall |
| 1800s | European Maps | Forest coverage changes |
Incorporating Archaeological Data with Historical Maps
Settlement Pattern Analysis
Archaeological data integration with historical maps reveals previously hidden patterns of human settlement development. Ground-penetrating radar surveys overlaid on 18th-century maps expose buried structures like roads walls foundations that validate or challenge documented settlements. Digital elevation models combined with historical cadastral maps help identify defensive positions trading posts agricultural zones based on topographical advantages. For example archaeologists studying Medieval European settlements use LIDAR data with period maps to trace urban growth patterns defensive walls lost villages.
Ancient Infrastructure Studies
By merging archaeological findings with historical maps you’ll uncover extinct transportation networks water management systems agricultural layouts. Remote sensing data aligned with Roman-era maps exposes forgotten aqueducts roads trade routes that shaped ancient economies. Magnetometer surveys combined with Chinese dynasty maps reveal irrigation systems city grids burial grounds missing from written records. Modern GIS analysis of these layered datasets helps quantify infrastructure scale calculate resource distribution identify engineering achievements previously only theorized in historical texts.
Using Linguistic Analysis in Map Interpretation
Linguistic analysis reveals hidden layers of historical and cultural information embedded in maps through the study of text elements place names and regional language patterns.
Place Name Etymology
Place names on historical maps serve as linguistic fossils preserving ancient languages cultural migrations and historical events. Analysis of toponyms reveals patterns of settlement waves demographic shifts and cultural influences. For example Norse place names ending in “-by” or “-thorpe” across Britain mark Viking settlements while Native American place names like “Mississippi” (meaning “great river”) preserve indigenous geographic knowledge. Modern GIS databases enable systematic analysis of place name patterns to track historical population movements and cultural exchanges.
Regional Dialect Mapping
Historical maps often capture regional language variations through spelling differences annotation styles and local terminology for geographical features. Maps from medieval Europe show dialect boundaries through distinct naming conventions for rivers mountains and settlements. Digital humanities tools now allow researchers to overlay dialect maps with historical boundaries revealing connections between political divisions and language evolution. For instance 16th-century German maps display regional spelling variations that align with historical dialect zones documented by modern linguists.
Applying Modern Scientific Methods
Carbon Dating of Map Materials
Carbon dating revolutionizes historical map authentication by providing precise age estimates of physical materials. This technique analyzes the decay of carbon-14 isotopes in organic map components like paper fibers parchment or leather backing. Labs can date materials within 50-year accuracy ranges which helps identify forgeries or validate contested map origins. The British Library used this method to authenticate the Vinland Map determining it was created in the 1920s not the 15th century as previously claimed.
Chemical Analysis of Inks and Pigments
Advanced spectroscopic techniques reveal the chemical composition of historical map pigments and inks. X-ray fluorescence (XRF) scanning identifies elements in colored inks while Raman spectroscopy detects organic compounds in writing materials. These methods expose anachronistic materials that indicate forgeries or later modifications. For example scientists used XRF analysis to prove several 16th-century Dutch maps contained titanium white pigment which wasn’t manufactured until 1916 revealing modern alterations.
Understanding Maps Through Economic History
Historical maps serve as crucial documents for understanding past economic systems geographic distribution of wealth and commercial networks.
Resource Distribution Patterns
Historical maps reveal intricate patterns of natural resource allocation and exploitation across different time periods. Medieval European maps highlight mining districts mineral deposits and timber reserves through specialized symbols and annotations. These maps track the flow of valuable commodities like silver gold spices and silk allowing historians to reconstruct ancient trade networks. For example Chinese Song Dynasty maps (960-1279 CE) detailed salt production centers tea plantations and porcelain manufacturing hubs using distinctive markers that indicate production volume and trade importance.
Market Center Analysis
Market centers on historical maps illuminate complex economic hierarchies and trading relationships. You’ll find medieval market towns marked by distinctive symbols indicating their commercial status fair dates and trading privileges. Islamic cartographers detailed caravanserai locations along trade routes while Hanseatic League maps highlighted warehouse districts and merchant quarters. These maps often include specific details about market days specialized products and toll stations creating a detailed picture of regional economic systems. For instance Venice’s 15th-century portolan charts marked trading posts with symbols indicating their economic importance and available commodities.
Synthesizing Multiple Interpretative Approaches
Historical maps offer far more than geographical information when you look beyond their surface. By combining modern technology archaeological findings linguistic analysis and scientific methods you’ll unlock rich layers of cultural economic and social insights.
These diverse approaches to map interpretation create a comprehensive understanding of how past societies viewed their world. Through careful analysis you can trace ancient trade routes decode cultural symbolism and uncover forgotten settlements that shaped our present reality.
As you explore historical maps remember they’re not just navigational tools but windows into past civilizations. Whether you’re using GIS technology analyzing place names or studying artistic elements each approach adds depth to our understanding of human history. The future of historical map interpretation lies in this multifaceted approach combining traditional methods with cutting-edge technology.


