11 Techniques for Effective Map Storytelling Through Design That Transform Data
Maps have evolved far beyond simple navigation tools into powerful storytelling devices that can transform complex data into compelling visual narratives. When you combine thoughtful design principles with cartographic elements, you’ll create maps that not only inform but also engage and inspire your audience.
In today’s data-driven world, mastering the art of map storytelling has become essential for designers, journalists, and data visualization experts who want to communicate spatial information effectively. Whether you’re visualizing demographic patterns, tracking historical events, or illustrating environmental changes, understanding key design techniques will help you craft maps that leave a lasting impact on your viewers.
Disclosure: As an Amazon Associate, this site earns from qualifying purchases. Thank you!
Understanding the Power of Visual Map Narratives
Maps have evolved beyond simple location references into powerful storytelling tools that shape how we understand and interact with spatial information.
How Maps Tell Stories
Maps communicate complex narratives through carefully chosen visual elements including colors symbols and spatial relationships. Effective map storytelling combines geographic data with visual hierarchy typography and color psychology to guide viewers through information layers. Modern digital maps use interactive elements zoom levels and temporal features to create deeper engagement allowing users to explore stories at their own pace. Strategic use of labels annotations and legends transforms raw geographic data into meaningful narratives that reveal patterns trends and connections.
The Science Behind Map Perception
Human brains process visual map elements through distinct cognitive pathways that influence how we absorb spatial information. Color combinations affect emotional responses while symbol placement impacts attention patterns and memory retention. Research shows viewers typically scan maps in an F-shaped pattern focusing first on the top left corner. The brain naturally groups similar elements and seeks familiar patterns which explains why consistent styling and clear visual hierarchies improve map comprehension. Understanding these perceptual principles helps designers create maps that align with natural cognitive processes.
Choosing the Right Map Projection and Scale
Selecting appropriate projection and scale forms the foundation of effective map storytelling as these choices directly influence how your audience perceives geographic information.
Impact of Projection on Story Focus
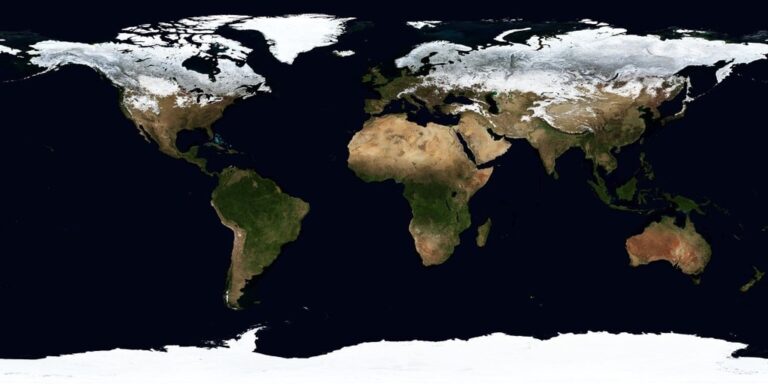
Your choice of map projection significantly shapes the narrative by emphasizing specific geographic aspects. The Mercator projection excels for navigation but distorts polar regions while equal-area projections like Mollweide maintain accurate size relationships for thematic mapping. Choose cylindrical projections for equatorial regions interrupted projections for oceanic stories or conic projections for mid-latitude continental narratives. Match your projection to your story’s geographic focus to avoid misleading visual representations that could detract from your message.
Determining Appropriate Scale Levels
Select your map scale based on the spatial extent of your story and the level of detail required. Use large scales (1:24,000 or larger) for neighborhood or city-level narratives to show building footprints street patterns or local landmarks. Choose medium scales (1:100,000 to 1:500,000) for regional stories that highlight transportation networks or administrative boundaries. Opt for small scales (1:1,000,000 or smaller) when telling continental or global stories that emphasize broad patterns or relationships. Consider implementing dynamic scaling for digital maps to allow users to explore different detail levels.
Mastering Color Theory in Map Design
Color selection forms the foundation of effective map communication serving as a powerful tool to guide attention convey meaning and create visual harmony.
Using Color to Convey Meaning
Map colors should align with intuitive associations and data relationships. Use blue shades for water bodies green for vegetation and red for warning or danger zones. Apply sequential color schemes (light to dark) for quantitative data diverging schemes for data that spreads from a central point and qualitative schemes for categorical information. Select color combinations that match your data type such as single-hue progressions for showing intensity or complementary colors for contrasting categories.
Creating Visual Hierarchy Through Color
Establish a clear visual hierarchy by using color saturation and brightness strategically. Apply vibrant colors to highlight primary information while using muted tones for background elements. Create depth by using darker shades for foreground features and lighter tints for contextual layers. Limit your palette to 5-7 colors to maintain clarity and implement consistent color coding across related map elements including legends and supplementary graphics.
Ensuring Color Accessibility
Design with colorblind users in mind by avoiding problematic combinations like red-green. Test your maps using colorblind simulation tools and maintain sufficient contrast ratios (4.5:1 minimum) between text and background colors. Include pattern overlays or texture variations to supplement color differences. Use tools like ColorBrewer 2.0 to select colorblind-safe palettes and provide alternative ways to distinguish between map features through labels symbols or patterns.
Implementing Effective Typography and Labels
Typography and labeling serve as crucial elements in map design that guide readers through geographic information while maintaining visual harmony and clarity.
Font Selection for Map Elements
Choose sans-serif fonts like Arial or Helvetica for primary map labels to ensure readability at various scales. Select condensed fonts for areas with limited space and use consistent font families throughout your map. Consider fonts specifically designed for cartography such as Noto Sans which supports multiple languages and maintains legibility across different display resolutions. Limit your map to 2-3 complementary typefaces to maintain visual cohesion.
Label Placement Best Practices
Position labels to clearly associate with their features while avoiding overlap with other map elements. Place point labels to the upper right of symbols curved labels along linear features like rivers or roads. Implement label collision detection in digital maps to prevent overlapping text. Use leader lines sparingly and only when necessary to connect labels to smaller features. Maintain consistent spacing between labels and their corresponding elements.
Text Hierarchy Guidelines
Establish a clear visual hierarchy through systematic size variations: major cities at 12pt primary features at 10pt and secondary elements at 8pt. Use weight contrast to differentiate between feature types with bold text for important locations and regular weight for supporting information. Apply opacity adjustments to create depth with 100% opacity for primary labels and 70-80% for background text. Structure your typography to guide viewers from most to least important information.
Incorporating Visual Elements and Symbology
Visual elements and symbols serve as the fundamental building blocks that transform raw geographic data into compelling map narratives.
Custom Icon Design
Create unique icons that instantly convey your map’s theme while maintaining visual consistency. Design symbols with distinct silhouettes that remain recognizable at multiple scales. Use simplified geometric shapes for better legibility and consider cultural context when developing icons. Stick to a unified style across your icon set by maintaining consistent stroke weights line styles and color palettes. Tools like Adobe Illustrator or Inkscape help create scalable vector icons that remain crisp at any resolution.
Symbol Size and Placement
Establish a clear visual hierarchy through strategic symbol sizing and careful placement. Scale symbols proportionally to their importance with primary features 25-30% larger than secondary elements. Position symbols to minimize overlap and maintain a balanced composition across the map canvas. For point features leave adequate breathing room – typically 1.5 times the symbol diameter. Adjust symbol density based on zoom levels in digital maps to prevent cluttering at different scales.
Legend Design Principles
Structure your legend to reflect the map’s visual hierarchy using consistent spacing and alignment. Organize elements from most to least important with grouped categories and clear headers. Keep legend items concise using 5-7 entries per category maximum. Match symbol sizes in the legend exactly to their map counterparts and align text consistently. Include units of measurement where applicable and use neutral background colors that don’t compete with map symbols.
Utilizing Map Layers and Data Organization
Effective layer management transforms complex spatial data into clear visual narratives while maintaining optimal performance and user experience.
Layer Hierarchy Strategies
Organize your map layers using a structured top-down approach with thematic groupings. Place point features above polygons and essential information in higher layers for immediate visibility. Create logical layer groups such as “Base Geography” “Demographics” and “Infrastructure” to manage related datasets. Use standardized naming conventions like “2023_Population_Density” and “Major_Roads_2023” to maintain consistency and enable quick identification of data vintage and content.
Managing Data Complexity
Simplify complex datasets through strategic generalization and filtering techniques. Apply scale-dependent rendering to show detailed features only at appropriate zoom levels. Use attribute filters to display only relevant data points based on specific criteria or thresholds. Implement spatial indexing for large datasets to improve loading times and create filtered views that highlight key patterns while maintaining data integrity.
Interactive Layer Controls
Design intuitive layer toggles that allow users to explore different data combinations. Include transparency sliders for overlay layers and implement radio buttons for mutually exclusive layers like different basemaps. Add hover states and tooltips to explain layer content and provide smart layer groups that automatically adjust visibility based on zoom levels. Incorporate preset layer combinations as “Map Views” to highlight specific themes or stories within your data.
Adding Context Through Supplementary Elements
Contextual elements enrich map storytelling by providing essential reference points and deeper data insights that help viewers better understand geographic relationships and patterns.
Inset Maps and Locators
Inset maps strengthen spatial awareness by showing your map’s location within a broader geographic context. Position small overview maps in empty corners using consistent styling but simplified features. For regional studies include both continental and national locator insets while city-level maps benefit from neighborhood context. Maintain visual connection through matching colors and coordinate reference frames between main and inset maps.
Scale Bars and North Arrows
Place scale bars and north arrows strategically to aid distance estimation and orientation without disrupting the main narrative. Choose scale bar units matching your audience’s reference system (miles vs kilometers) and use clean designs that complement your map style. Consider dynamic scale bars for interactive maps that update with zoom levels. North arrows should be simple yet visible featuring minimal decoration unless specifically themed.
Supporting Graphics and Charts
Integrate complementary data visualizations to reveal patterns and relationships that strengthen your map’s story. Add population pyramids for demographic analysis focused bar charts for temporal trends or scatter plots showing correlations between mapped variables. Position graphics near relevant map regions using matching colors typography and styling. Include clear titles and labels while maintaining proper visual hierarchy with the main map.
Optimizing Map Interactivity and User Experience
Digital maps require thoughtful interaction design to enhance user engagement and information discovery.
Navigation Controls
Design intuitive navigation controls that enhance map exploration without cluttering the interface. Place zoom buttons in the top-left corner and implement scroll-wheel zooming for familiar interaction patterns. Include a home button to reset the view and a fullscreen toggle for immersive viewing. Add pan controls through click-and-drag functionality and arrow buttons for precise movements. Ensure controls remain visible yet unobtrusive with semi-transparent backgrounds and hover effects.
Pop-up Information Design
Create concise pop-ups that display relevant information when users interact with map features. Structure content with clear hierarchies using bold headers for primary data and regular text for details. Limit pop-up size to 300×400 pixels and include close buttons in consistent locations. Design mobile-friendly pop-ups that scale appropriately and implement swipe gestures for navigation. Use tooltips for quick preview information before full pop-up engagement.
Responsive Layout Considerations
Implement fluid layouts that adapt seamlessly across devices and screen sizes. Set breakpoints at common device widths (320px 768px 1024px) to optimize map display. Adjust control placement and size based on available screen space using CSS media queries. Stack legend elements vertically on mobile devices and horizontally on desktop views. Ensure touch targets meet minimum size requirements (44×44 pixels) for mobile users while maintaining precise cursor interaction on desktop devices.
Enhancing Narrative Flow Through Animation
Dynamic animations transform static maps into engaging stories by guiding viewers through spatial data in a controlled sequence.
Timeline-based Animations
Timeline animations reveal temporal patterns by displaying data changes across specific time periods. Create smooth transitions between different time points using consistent intervals such as years decades or seasons. Set appropriate animation speeds (2-3 seconds per frame) to allow viewers to process changes in population growth urban expansion or climate patterns. Tools like QGIS Temporal Controller or ArcGIS Time Slider help synchronize temporal data with visual elements.
Sequential Data Reveals
Strategic data reveals build narrative tension by progressively introducing map elements. Start with base geography then layer in key features points of interest or thematic data. Use fade-in effects (0.5-1 second duration) to maintain visual hierarchy while avoiding information overload. Implement step-by-step reveals for complex datasets such as transportation networks demographic patterns or environmental changes. Control timing to match natural reading patterns.
Transition Effects
Thoughtful transitions maintain context while shifting between map views or zoom levels. Apply smooth pan and zoom animations (1-1.5 seconds) when moving between locations. Use crossfades (0.7 seconds) for switching between thematic layers or time periods. Implement subtle motion effects like pulse or glow to highlight important features without disrupting the overall flow. Keep transitions consistent throughout the narrative to establish rhythm and predictability.
Creating Compelling Map Layouts
Creating an effective map layout requires careful attention to design principles that guide viewers through your geographical narrative. Here’s how to master the essential elements of layout design:
Balance and Composition
Position your map elements using the visual weight principle to create harmony across your layout. Place your main map in the focal point (typically slightly above center) and arrange supporting elements like legends titles and scale bars around it in a balanced pattern. Use the rule of thirds to divide your canvas into nine equal sections helping you align key components. Maintain proportional relationships between elements ensuring your legend doesn’t overpower your main map or that inset maps remain appropriately sized.
White Space Utilization
Leverage negative space strategically to enhance map readability and reduce visual clutter. Keep margins consistent usually 10-15% of your total canvas width and maintain breathing room between map elements. Use white space to create natural breaks between different information zones like separating your main map from supplementary charts or text blocks. Avoid the temptation to fill every available space instead letting your design breathe through purposeful spacing.
Visual Flow Direction
Guide your viewer’s eye through the map narrative using directional cues and hierarchy. Arrange elements in a logical sequence starting from the title through the main map to supporting information. Place frequently referenced items like legends and scale bars within easy reach of the main map. Use alignment and spacing to create implicit directional paths leading viewers through your story. Consider cultural reading patterns (left-to-right in Western contexts) when positioning sequential information.
Conclusion: Bringing Your Map Story to Life
Mastering map storytelling through design requires a thoughtful blend of technical expertise and creative vision. You’ll find that successful map narratives emerge from careful attention to projection selection color theory typography and interactive elements working in harmony.
Your maps can transform complex spatial data into engaging visual stories when you apply these design principles strategically. Remember that every design choice from symbol placement to animation timing plays a crucial role in guiding your audience through the narrative.
By keeping user experience at the forefront of your design process you’ll create maps that don’t just inform – they inspire and engage. Now you’re ready to craft compelling map stories that resonate with your audience and effectively communicate your spatial data.


