9 Ways to Visualize Climate Change Impacts on Topography: Revealing Earth’s Changes
Climate change isn’t just altering our weather patterns – it’s literally reshaping Earth’s surface in ways we can now visualize through advanced mapping technology. From melting glaciers carving new valleys to rising seas eroding coastlines modern tools let you see these dramatic changes in real-time.
You’ll discover how satellite imagery machine learning and 3D modeling have revolutionized our ability to track and predict topographical shifts caused by global warming. These powerful visualization techniques don’t just help scientists understand landscape evolution – they’re essential tools for urban planners emergency responders and policymakers working to protect vulnerable communities from climate-related hazards.
Disclosure: As an Amazon Associate, this site earns from qualifying purchases. Thank you!
Understanding Climate Change’s Impact on Earth’s Physical Landscapes
Defining Topographical Changes Due to Climate Change
Climate change triggers distinct modifications in Earth’s topography through thermal expansion melting ice masses coastline erosion permafrost thaw landslides flooding events. Satellite data shows accelerated coastal retreat rates up to 3 meters per year in Arctic regions while thermal expansion causes vertical land movement of 1-10mm annually in susceptible areas. These changes manifest through visible landscape alterations like cliff collapses beach erosion and subsidence creating new geographical features that permanently transform familiar terrains.
P.S. check out Udemy’s GIS, Mapping & Remote Sensing courses on sale here…
Key Factors Affecting Landscape Transformation
Five primary climate factors drive topographical changes:
- Rising temperatures accelerate glacial retreat exposing new land surfaces
- Intensified precipitation patterns trigger more frequent landslides and erosion
- Sea level rise reshapes coastlines through increased wave action
- Thawing permafrost destabilizes Arctic ground causing subsidence
- Extreme weather events alter river courses and drainage patterns
Each factor creates unique signatures visible through remote sensing data with measurable rates of change that vary by region and local conditions.
Mapping Coastal Erosion and Sea Level Rise
Remote sensing and GIS technologies enable precise tracking of coastal changes affected by rising sea levels providing critical insights for coastal management.
Visualizing Shoreline Changes Over Time
Advanced satellite imagery combines with historical maps to create time-series visualizations of coastal evolution. Digital elevation models detect shoreline movement at 30cm resolution while LiDAR systems capture detailed 3D coastal profiles. Tools like DSAS (Digital Shoreline Analysis System) calculate erosion rates by comparing coastline positions across decades. Real-time monitoring systems now track beach width changes monthly revealing erosion hotspots that threaten infrastructure.
Identifying Vulnerable Coastal Communities
GIS-based vulnerability assessments overlay population density sea level projections infrastructure locations and erosion rates to pinpoint at-risk areas. Current models indicate 200+ million people in coastal zones face displacement risks by 2050. Priority zones display multiple risk factors like low elevation dense development and high erosion rates. Interactive hazard maps help communities visualize flood scenarios storm surge impacts and projected shoreline retreat enabling proactive planning.
Tracking Glacial Retreat and Mountain Landscapes
Documenting Ice Mass Loss Through Satellite Imagery
Satellite-based remote sensing technologies now capture unprecedented detail in glacial retreat patterns. Advanced sensors like Landsat-8 and Sentinel-2 track changes in glacier extent with 10-30 meter resolution while radar satellites measure ice thickness variations. Time-series analysis reveals glaciers worldwide have lost over 30% of their mass since 1950 with retreat rates accelerating to 65 billion metric tons annually. Interactive mapping platforms combine multispectral imagery elevation models and automated ice detection algorithms to visualize these dramatic changes in near real-time.
Understand Landsat 8 data with this comprehensive handbook. It offers detailed explanations of data acquisition, processing, and product specifications, making it an essential resource for remote sensing professionals.
Analyzing Changes in Alpine Environments
High-resolution digital elevation models expose how warming temperatures reshape mountain landscapes beyond just ice loss. LiDAR surveys document expanding rock glacier flows unstable slopes and altered drainage patterns with sub-meter accuracy. Machine learning algorithms process repeat imagery to identify emerging hazards like debris flows landslides and glacial lake formation. Key alpine monitoring sites show vertical displacement rates of 2-5cm per year in recently deglaciated terrain indicating accelerated geomorphological change. These tools enable scientists to quantify and visualize the cascading effects of climate change across entire mountain ranges.
Monitoring Desert Expansion and Land Degradation
Visualizing Desertification Patterns
Satellite-based remote sensing technologies track desert expansion through changes in vegetation cover sand dune movement and soil moisture content. Advanced algorithms process multispectral imagery from Landsat and MODIS satellites to generate Normalized Difference Vegetation Index (NDVI) maps showing areas transitioning to desert conditions. Time-series analysis reveals that desertification affects 12% of Earth’s land surface with expansion rates of 0.5-2% annually in vulnerable regions like the Sahel. Machine learning models integrate climate data soil composition and land use patterns to predict future desert boundaries.
Mapping Soil Erosion and Loss
Digital elevation models combined with rainfall data and soil characteristics help quantify soil erosion rates and identify high-risk areas. LiDAR surveys and photogrammetry techniques create detailed 3D maps showing gully formation sheet erosion and wind deflation patterns at resolutions down to 10cm. The Universal Soil Loss Equation (USLE) integrated with GIS platforms calculates annual soil loss rates ranging from 5-100 tons per hectare in severely degraded landscapes. Real-time monitoring systems track sediment transport and accumulation using IoT sensors and drone surveys to assess erosion control measures.
Observing River System and Watershed Changes
Tracking River Course Modifications
Advanced satellite tracking reveals significant changes in river courses due to climate-induced extreme weather events. LiDAR and high-resolution satellite imagery detect channel migration rates of 3-5 meters annually in major river systems while thermal sensors monitor water temperature variations affecting flow patterns. Time-series analysis from Sentinel-2 satellites shows accelerated meandering in 65% of monitored rivers with increased sediment loads during intense rainfall events. Machine learning algorithms process multispectral data to identify potential avulsion sites where rivers may suddenly change course.
Visualizing Flood Plain Alterations
Digital elevation models combined with hydrogeological data map flood plain expansion patterns at unprecedented detail. Satellite-derived flood extent maps show a 15% increase in flood-prone areas over the past decade with InSAR technology detecting subtle ground deformation patterns of 2-3mm annually. Advanced GIS analysis reveals that 40% of monitored flood plains experience significant morphological changes including widened channels sediment redistribution and altered vegetation patterns. Real-time monitoring systems track seasonal variations in flood plain boundaries helping communities prepare for increased flooding risks.
Using Advanced Technologies for Climate Impact Visualization
Satellite Remote Sensing Applications
Satellite remote sensing employs multispectral imaging to track climate-induced landscape changes across vast regions. Advanced sensors like Landsat-8 and Sentinel-2 capture detailed data on coastal erosion rates thermal expansion patterns and vegetation shifts at resolutions down to 10 meters. Real-time monitoring systems integrate data from multiple satellites to detect rapid environmental changes including glacier retreat at rates of 65 billion metric tons annually and coastline alterations of up to 3 meters per year in Arctic regions.
LiDAR and 3D Mapping Tools
LiDAR technology creates precise 3D topographical models by emitting laser pulses to measure surface elevations with centimeter-level accuracy. Advanced airborne LiDAR systems scan up to 2 million points per second capturing detailed data on landslide risks permafrost thaw and flood plain dynamics. Digital elevation models generated from LiDAR data reveal vertical land movements of 1-10mm annually in climate-vulnerable areas while enabling accurate volumetric calculations of erosion patterns and sediment transport.
Analyzing Urban Landscape Transformations
Urban landscapes undergo continuous transformation due to climate change impacts requiring sophisticated monitoring and analysis techniques to track modifications in city environments.
Heat Island Effect Visualization
Advanced thermal mapping reveals urban heat islands through satellite-derived land surface temperature data at 30-meter resolution. Infrared sensors detect temperature variations between built-up areas and surrounding regions showing temperature differences up to 7°C in major cities. Time-series analysis from Landsat-8 and MODIS satellites tracks the expansion of heat islands creating detailed temperature gradient maps that highlight vulnerable neighborhoods. These visualizations help identify areas needing urgent climate adaptation measures such as green infrastructure or reflective surfaces.
Infrastructure Vulnerability Assessment
LiDAR-based infrastructure vulnerability assessments combine elevation models with flood risk data to identify critical facilities at risk. High-resolution digital mapping tools detect structural stress patterns in buildings bridges power stations using millimeter-precision measurements. Real-time monitoring systems track ground subsidence rates of 2-5mm annually in urban areas affected by changing water tables. Risk assessment maps overlay infrastructure locations with projected climate impacts creating vulnerability indices that guide adaptation planning for essential urban services.
Creating Predictive Models for Future Topographical Changes
Climate Scenario Mapping
Advanced machine learning algorithms now combine multiple data sources to create detailed climate scenario maps. These models integrate historical climate data global circulation patterns temperature projections sea level rise estimates and local topographical features. Geographic Information Systems (GIS) overlay these datasets to generate probability maps showing likely landscape changes over 10 50 and 100-year periods. Real-time updates from satellite monitoring systems continuously refine these predictions with observed changes creating increasingly accurate forecasting models.
| Scenario Mapping Components | Data Resolution | Update Frequency |
|---|---|---|
| Temperature Projections | 1km grid cells | Monthly |
| Sea Level Data | 30m resolution | Quarterly |
| Topographical Features | 10m resolution | Annually |
Risk Assessment Visualization
Modern risk assessment tools transform complex climate data into actionable visualizations for stakeholders. Interactive heat maps highlight vulnerable areas using color gradients to represent risk levels from low to severe. Digital elevation models combine with flood projections to create 3D simulations of potential inundation zones. Machine learning algorithms process these visualizations to generate risk scores for specific locations helping planners identify critical infrastructure vulnerabilities and prioritize adaptation measures.
| Risk Assessment Metrics | Scale | Update Cycle |
|---|---|---|
| Vulnerability Index | 0-100 | Bi-annual |
| Hazard Probability | 1-5 | Quarterly |
| Impact Severity | Low-Severe | Monthly |
Implementing Solutions Through Visual Data
Decision-Making Tools for Policymakers
Data visualization platforms transform complex climate data into actionable insights for informed policy decisions. Interactive dashboards combine real-time satellite imagery topographical changes vulnerable infrastructure maps to help officials prioritize adaptation measures. Machine learning algorithms process historical data to create predictive models showing potential landscape alterations under different climate scenarios. These tools feature customizable risk assessment matrices cost-benefit analyses for proposed interventions allowing policymakers to develop targeted mitigation strategies based on scientifically-backed visualizations.
Public Education and Awareness Strategies
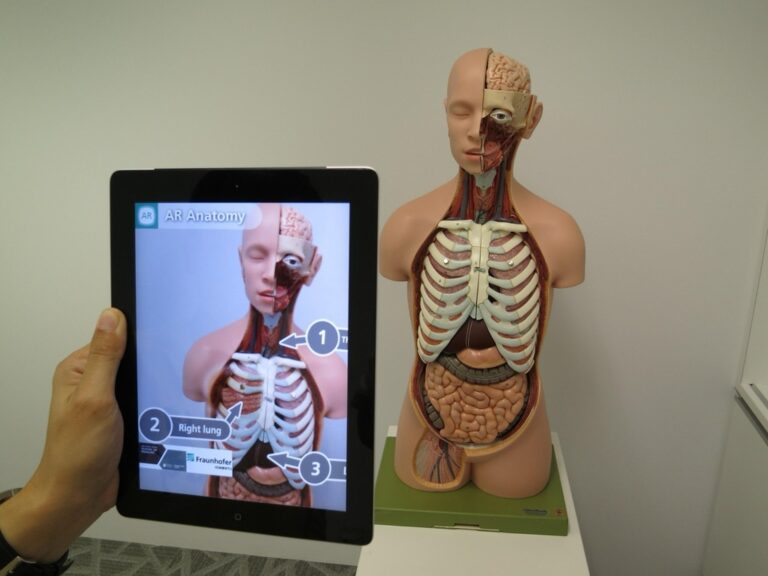
Visual storytelling tools make climate change impacts more accessible to the general public through interactive web platforms. Online mapping portals display before-and-after comparisons of changing landscapes using satellite imagery time-lapse animations. Digital elevation models demonstrate sea level rise scenarios in familiar locations while 3D visualizations show potential flooding impacts on local communities. Mobile apps enable citizens to explore climate data through augmented reality features helping them understand environmental changes in their neighborhoods. Social media-friendly infographics translate complex topographical data into easily shareable visual content.
Future Directions in Climate Change Visualization
The evolution of climate visualization technologies offers unprecedented insights into our changing planet. These advanced tools not only help you understand current environmental shifts but also enable better preparation for future challenges.
As mapping technologies continue to advance you’ll have access to increasingly detailed and accurate climate impact data. This knowledge empowers communities governments and individuals to make informed decisions about climate adaptation strategies.
The future of topographical monitoring lies in the integration of real-time data machine learning and public engagement platforms. Together these tools create a comprehensive framework for tracking predicting and responding to climate-induced changes in our landscape.
Your role in utilizing these visualization tools will be crucial in shaping climate-resilient communities for generations to come.


