12 Mapping Style Evolution Milestones That Shaped Modern Cartography
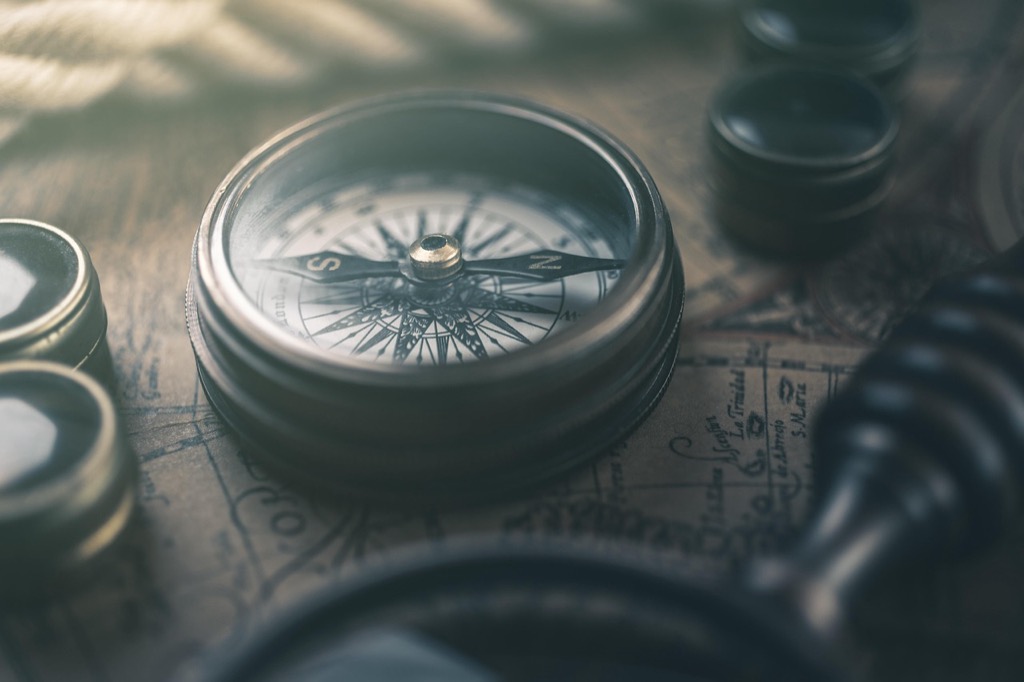
Maps have transformed from simple cave drawings to sophisticated digital interfaces capturing humanity’s endless quest to understand and navigate our world. Through the centuries these visual guides have evolved dramatically reflecting advances in technology mathematical understanding and artistic expression.
You’ll discover how ancient civilizations used stars and landmarks to create basic maps while modern cartographers harness satellite data and computer algorithms to generate hyper-accurate 3D representations of Earth’s surface.
Disclosure: As an Amazon Associate, this site earns from qualifying purchases. Thank you!
Understanding Ancient Cartography: From Cave Paintings to Early Maps
Prehistoric Map-Making Methods
Early humans created basic maps through cave paintings depicting hunting grounds navigation routes and territorial boundaries. These primitive cartographic expressions used ochre charcoal and natural pigments to mark important landmarks rivers and mountain ranges. Archaeological evidence shows that Ice Age cultures in Europe created spatial representations on cave walls mammoth tusks and bones dating back 16500 BCE. Notable examples include the Abauntz Cave maps in Spain and the Pavlov map from the Czech Republic which demonstrate early understanding of scale distance and spatial relationships.
Egyptian and Mesopotamian Mapping Techniques
Ancient Egyptians developed sophisticated mapping systems using papyrus scrolls and geometric calculations to survey land after annual Nile floods. Their surveyors called “rope stretchers” used standardized measuring ropes to create accurate property boundaries and architectural plans. Mesopotamian civilizations crafted detailed clay tablet maps featuring cities irrigation systems and trade routes. The Babylonian World Map (600 BCE) represents one of the earliest known attempts to show the known world with Babylon at its center using cuneiform script to label geographical features mountains and oceans.
Classical World Mapping Innovations
Greek Mathematical Mapping Systems
Greek cartographers revolutionized mapping through mathematical principles and astronomical observations. Ptolemy introduced the grid system with latitude and longitude coordinates in 150 CE which formed the foundation of modern cartography. The Greeks developed methods to calculate Earth’s circumference with remarkable accuracy using geometry and shadow measurements. Their innovations included spherical trigonometry for map projections systematic documentation of geographical coordinates and the first scaled maps based on astronomical positioning.
Roman Pragmatic Mapping Approaches
Roman cartographers focused on practical applications creating detailed road maps and urban plans for their vast empire. The famous Forma Urbis Romae provided an intricate marble plan of ancient Rome at a scale of 1:240. Romans pioneered standardized distance measurements using mile markers and developed the itineraria which documented travel routes with precise distances between locations. Their mapping emphasized infrastructure military strategy and administrative boundaries leading to innovations in survey techniques and distance calculation methods.
Medieval Mapping Traditions
European Monastery Maps
Medieval European monasteries became crucial centers for map creation during the Middle Ages. Monk cartographers crafted elaborate mappae mundi (world maps) that combined geographic knowledge with Christian theology. The Hereford Mappa Mundi (1300 CE) represents one of the finest examples featuring Jerusalem at its center with Paradise at the top. These maps prioritized religious symbolism over geographic accuracy incorporating biblical scenes angels mythical creatures & trade routes known to medieval Europe.
Islamic Golden Age Cartography
Islamic cartographers revolutionized medieval mapping through mathematical precision & astronomical observations. Al-Idrisi’s Tabula Rogeriana (1154 CE) created for King Roger II of Sicily combined Greek knowledge with contemporary Arabic explorations. Muslim scholars developed advanced instruments like the astrolabe & preserved classical geographic texts while adding their own discoveries. Their maps featured detailed Mediterranean coastlines trade routes & major cities with unprecedented accuracy for their time.
Asian Mapping Techniques
Chinese cartographers led Asian mapping innovations during the medieval period using the grid system centuries before European adoption. The Yu Ji Tu map (1137 CE) carved in stone demonstrated sophisticated surveying techniques with scaled coordinates. Japanese cartographers created detailed provincial maps (Gyōki-zu) while Korean mapmakers developed unique projection methods. These Asian traditions emphasized practical navigation administrative boundaries & topographical features using woodblock printing techniques.
Renaissance Revolution in Cartography
Introduction of Grid Systems
The Renaissance period marked a transformative shift in cartographic precision through standardized grid systems. Cartographers like Gerardus Mercator introduced mathematical principles to create uniform coordinate systems based on latitude and longitude lines. These innovations enabled mapmakers to plot locations with unprecedented accuracy using tools like the quadrant astrolabe to measure celestial positions and calculate geographic coordinates.
Development of Projection Methods
Renaissance cartographers tackled the fundamental challenge of representing Earth’s spherical surface on flat paper through innovative projection techniques. Mercator’s revolutionary projection method in 1569 allowed sailors to plot straight-line courses while maintaining angular relationships between points. This mathematical breakthrough supported long-distance navigation despite distorting landmass sizes near the poles.
Maritime Navigation Maps
Portolan charts emerged as essential tools for maritime exploration during the Renaissance era. These detailed nautical maps featured compass roses rhumb lines and coastal landmarks to guide Mediterranean and Atlantic navigation. Portuguese cartographers enhanced these maps by incorporating wind patterns trade routes and newly discovered lands while Spanish mapmakers added depth soundings and harbor approaches to support colonial expansion.
Age of Exploration Mapping Styles
European exploration between the 15th and 17th centuries revolutionized cartography through unprecedented documentation of new territories coastlines and trade routes.
Colonial Territory Mapping
Colonial powers developed detailed mapping systems to document their territorial claims during the Age of Exploration. Portuguese cartographers created the padrão system marking newly claimed territories with stone pillars while recording their exact positions on maps. Spanish explorers utilized the Casa de Contratación’s standardized mapping protocols to document the Americas establishing the first systematic colonial mapping approach. These maps featured precise coastal outlines detailed interior topography and strategic military positions.
Trade Route Documentation
Maritime trade maps evolved significantly during this period incorporating vital navigation data. Cartographers added wind patterns ocean currents and seasonal weather information to existing portolan charts. The Dutch East India Company’s secret atlas collection included detailed Asian trade routes harbors and hazards. These maps featured depth soundings safe anchorages and trading post locations marking a shift toward practical commercial cartography.
Scientific Survey Methods
Explorers adopted more rigorous scientific methods to improve mapping accuracy. They used astronomical observations chronometers and mathematical calculations to determine longitude and latitude. Spanish expeditions employed standardized survey techniques to measure distances while Portuguese navigators developed sophisticated methods for celestial navigation. These advancements led to the creation of more precise coastal charts and interior land surveys establishing modern cartographic standards.
Industrial Era Cartographic Advances
The Industrial Revolution transformed mapping through mechanical reproduction techniques and the need for precise infrastructure documentation.
Railway and Infrastructure Mapping
Railway companies pioneered specialized mapping techniques in the 1830s to plan complex rail networks. Engineers developed detailed elevation profiles strip maps showcasing gradients topography and land ownership along proposed routes. The London Underground map of 1863 introduced schematic transit mapping displaying connections rather than geographic accuracy. These innovations established standardized symbols for railways bridges tunnels and signal systems that remain in use today.
Topographic Mapping Techniques
Surveyors adopted new tools like theodolites and plane tables to create accurate terrain representations in the mid-1800s. The British Ordnance Survey implemented consistent contour line intervals and standardized symbols for depicting landscape features. Military needs drove the development of precise elevation mapping with the USGS establishing the 7.5-minute quadrangle system in 1879. These methods introduced systematic approaches to showing relief drainage patterns and land cover.
Urban Planning Maps
Industrial cities required detailed planning maps to manage rapid growth and infrastructure development. Sanborn Fire Insurance maps emerged in 1867 providing building-by-building documentation of urban areas with color-coding for construction materials. City planners developed zoning maps to regulate land use while engineers created utility maps showing water sewer and gas networks. These specialized urban maps established modern conventions for displaying complex municipal infrastructure systems.
Modern Digital Mapping Evolution
The digital revolution transformed cartography through powerful computing tools and satellite technology enabling unprecedented mapping capabilities and accessibility.
Satellite Mapping Technology
Satellite mapping revolutionized cartography by providing high-resolution Earth observation data through remote sensing technologies. GPS satellites now deliver precise positioning data accurate to within centimeters while Earth observation satellites like Landsat capture detailed imagery every 16 days. Advanced sensors collect multispectral data enabling analysis of vegetation health flood monitoring and urban development tracking. These systems integrate with ground stations to process terabytes of spatial data creating detailed topographic maps and 3D terrain models.
Geographic Information Systems
GIS technology emerged in the 1960s transforming how we collect analyze and visualize spatial data. Modern GIS platforms like ESRI’s ArcGIS and open-source QGIS enable complex spatial analysis through layered data management. Users can now overlay multiple data types including demographics transportation networks and environmental factors. These systems support real-time data integration machine learning algorithms and automated cartography allowing organizations to make data-driven decisions through powerful spatial analytics.
Interactive Digital Maps
Web-based mapping platforms have democratized digital cartography through user-friendly interfaces and crowd-sourced data. Applications like Google Maps OpenStreetMap and Mapbox provide customizable interactive experiences with features like real-time traffic updates route planning and location-based services. Mobile mapping apps leverage smartphone sensors to deliver turn-by-turn navigation while augmented reality integration enables immersive mapping experiences. These platforms support API integration allowing developers to create specialized mapping applications for diverse industries.
Contemporary Mapping Trends
Modern mapping continues to evolve with technological advancements creating new possibilities for spatial visualization and interaction.
3D Terrain Visualization
Advanced 3D terrain visualization tools now render photorealistic landscapes using high-resolution elevation data and satellite imagery. Programs like ArcGIS Pro and QGIS integrate LiDAR point clouds to create detailed digital terrain models with sub-meter accuracy. Users can interact with these 3D maps through dynamic fly-throughs viewing landscapes from multiple angles while analyzing elevation profiles slope aspects and watershed boundaries in real-time. These visualizations help urban planners analyze viewsheds assess environmental impact and plan infrastructure projects.
Real-Time Dynamic Mapping
Real-time mapping systems now process massive data streams from IoT sensors traffic cameras and mobile devices to create living maps that update continuously. Platforms like Mapbox and HERE Technologies enable developers to build applications showing live traffic patterns weather conditions and crowd movements. Transportation agencies use these systems to optimize route planning while emergency services leverage real-time data for disaster response. Dynamic heat maps and flow visualizations reveal patterns in urban mobility asset tracking and resource distribution.
Augmented Reality Maps
AR mapping overlays digital information onto the physical world through smartphone cameras and smart glasses. Apps like Google Maps Live View project navigation arrows and points of interest directly onto street views. ESRI’s ArcGIS platform enables users to visualize underground utilities infrastructure and archaeological sites in their real-world context. Construction teams use AR maps to visualize building plans on-site while urban explorers access location-based historical information and cultural data through AR interfaces.
Future Directions in Cartography
AI-Powered Mapping Solutions
AI algorithms revolutionize mapping through automated feature detection and real-time updates. Machine learning models now process satellite imagery to identify roads buildings and land use changes with 95% accuracy. Deep learning networks enable automatic map updates by analyzing street-level imagery from mobile devices detecting new construction or changes in infrastructure. Advanced neural networks also enhance map personalization by learning user preferences and travel patterns to generate customized routing solutions that factor in real-time conditions traffic patterns and individual mobility needs.
Environmental Mapping Technologies
Environmental mapping evolves with advanced sensors that track climate patterns and ecological changes. LiDAR-equipped drones capture high-resolution 3D data of forest canopies wetlands and coastal regions with centimeter-level precision. Smart environmental sensors network across landscapes to monitor air quality water levels and soil conditions creating dynamic maps that update every 30 minutes. These systems integrate with climate models to visualize environmental changes predict natural disasters and support conservation efforts through detailed habitat mapping and species distribution tracking.
Personal Navigation Systems
Personal navigation transitions from screen-based interfaces to immersive experiences through augmented reality. Smart glasses project turn-by-turn directions onto your field of view while accounting for real-time obstacles and crowd movements. Haptic feedback systems guide users through vibration patterns eliminating the need for visual attention. These systems incorporate indoor positioning technology using ultra-wideband sensors and magnetic field mapping to maintain accuracy within 10 centimeters even inside complex buildings or underground structures.
The Continuing Evolution of Map Design
The journey of cartography showcases humanity’s remarkable ability to adapt and innovate in representing our world. From simple cave drawings to sophisticated digital interfaces your mapping experience today builds on centuries of technological and artistic advancement.
Modern mapping technologies have transformed how you interact with spatial information while maintaining the core purpose that drove our ancestors: understanding and navigating the world around us. As we venture into an era of artificial intelligence and augmented reality mapping continues to evolve at an unprecedented pace.
The future of cartography looks brighter than ever with emerging technologies promising even more intuitive and immersive ways to explore our world. You’re not just witnessing this evolution – you’re actively participating in it through the digital maps you use every day.


