10 Best Map Projections for Accurate Geographic Representation That Enhance Clarity
Choosing the right map projection can make or break your understanding of geography. Each projection distorts some aspect of reality, whether it’s shape, area, distance, or direction. By exploring the best options available, you can ensure your maps provide the most accurate representation of our world.
Disclosure: As an Amazon Associate, this site earns from qualifying purchases. Thank you!
Robinson Projection
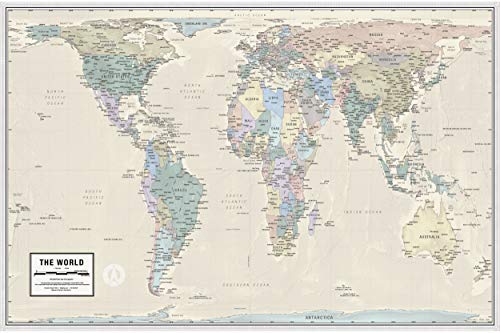
The Robinson projection balances size and shape, making it ideal for visually appealing world maps. It minimizes distortion across continents and oceans, providing a more realistic view.
Winkel Tripel Projection
Get the perfect fit for your space with our durable and stylish mat! Available in two sizes: 80x55 cm (Small) and 100x69 cm (Medium).
Widely used in physical and political maps, the Winkel Tripel provides a good balance of area, shape, and distance. It’s recognized by the National Geographic Society for its accuracy.
Mollweide Projection
Easily transform any room with this durable peel-and-stick wall mural. The six-panel design (96"x144" total) is crafted from premium materials, ensuring long-lasting beauty in homes and offices.
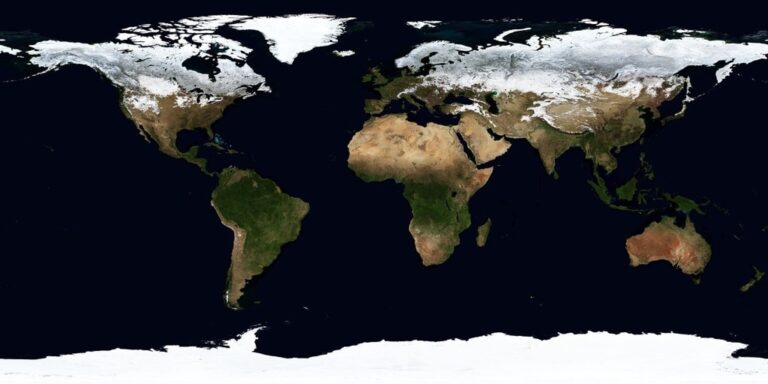
This projection is excellent for presenting statistical data, as it provides equal-area representation. Use it when displaying demographic or ecological information for precise area comparison.
Albers Equal Area Conic Projection
Understand map projections and choose the best one for your needs with this practical guide. Learn about different projection types and their specific applications.
Favor this projection for regional maps, especially in mid-latitude areas. The Albers projection maintains area proportions, making it useful for thematic mapping.
Lambert Conformal Conic Projection
Understand the complexities of the Lambert Conformal Conic projection with this comprehensive cartography guide. Explore its theoretical foundations and practical applications in mapmaking.
Ideal for aeronautical navigation and weather mapping, this projection preserves angles, allowing for accurate direction while minimizing distortion over short distances.
By understanding each projection’s strengths and limitations, you can choose the most suitable one for your mapping needs, ensuring clear, accurate geographic representation. Keep in mind that data limitations can affect the visual output; therefore, implementing quality control (QA/QC) practices at each stage of your workflow is essential.
Understanding Map Projections
See the world accurately with this map showing countries in their true size and proportion. It's printed on high-quality, laminated paper and shipped rolled for optimal teaching and display.
Map projections serve as essential tools in converting the Earth’s three-dimensional surface into a two-dimensional format, facilitating our understanding of geography. Each projection has its own strengths and limitations, making the choice critical for accurate representation.
Definition of Map Projections
Map projections are mathematical methods that transform geographical coordinates into plane coordinates. They allow you to represent the Earth’s features on a flat surface. The main types include conformal projections, which preserve angles but distort area and distance—such as the Mercator projection—and equal-area projections, which accurately represent the size of land and water bodies but may distort angles.
Importance of Accurate Geographic Representation
Accurate geographic representation is vital for effective communication and decision-making in mapping. Choosing the right projection affects how you perceive relationships between geographic elements. Projections like the Robinson or Winkel Tripel balance size and shape for better visual comprehension. Understanding each projection’s characteristics ensures you can convey information clearly while acknowledging that no projection is perfect. This comprehension helps mitigate potential misconceptions, maintaining the accuracy required for analysis and interpretation.
Common Types of Map Projections
Many map projections serve distinct purposes and applications, each with unique strengths. Understanding their differences can enhance your mapping craft.
Cylindrical Projections
Cylindrical projections project the Earth’s surface onto a cylinder, offering a rectangular representation. One prominent example is the Mercator projection, which maintains angular relationships, making it useful for navigation. However, it’s essential to note that this projection incurs high distortion near the poles. When mapping trade routes or maritime applications, cylindrical projections excel in maintaining course angles at the expense of size accuracy.
Conic Projections
Conic projections involve projecting the Earth onto a cone, which can be particularly effective for regional maps. The Albers Equal Area Conic projection is a popular choice, as it preserves area relationships, allowing for true size representation of landmasses. This projection is ideal for thematic mapping, particularly when focusing on population density or resource distribution. Consider using conic projections when your area of interest is significantly east-west in orientation.
Azimuthal Projections
Azimuthal projections involve projecting the Earth onto a flat plane from a specific point, commonly used for certain types of aerial views. The Stereographic projection is a prime example, maintaining angles but sacrificing area. This projection is often used in fields like radio range mapping and airline navigation, where accurate direction is crucial. When you need to depict distances from a central point accurately, azimuthal projections provide significant benefits.
The Best Map Projections for Accurate Geographic Representation
Mapping challenges arise when you need to balance geographic accuracy with visual clarity. You might face difficulties in representing data precisely while still ensuring that your maps are user-friendly and informative.
Establishing Technical Context
It’s essential to use the right methods and tools to translate data into accessible formats. Consider your audience’s requirements and the specific message your map needs to convey. With modern GIS software, such as ArcGIS Pro or QGIS, you can manipulate datasets effectively to create compelling maps.
Master ArcGIS Pro 3.2 with this comprehensive guide. Learn essential GIS workflows and data management techniques for effective spatial analysis.
Key Methods and Examples
Data Collection Techniques
- Utilize satellite imagery and aerial surveys for high-resolution data.
- Leverage GPS devices for field data collection.
Map Projections
- Select projections like Winkel Tripel or Robinson that minimize distortion for world maps.
- Consider local projections, such as Lambert Conformal Conic, for regional accuracy.
Color Schemes
- Apply Color Brewer color palettes to enhance visual discrimination.
Addressing Common Technical Issues
Common issues can include data misalignment or resolution mismatches. To mitigate these problems, ensure that:
- Your datasets are in the same coordinate system.
- You perform regular checks against authoritative datasets to validate accuracy.
Exploring Data Visualization Options
Effective data visualization can significantly improve your maps. Consider these strategies:
- Layering Techniques: Use multiple layers to present different datasets distinctly.
- Interactive Elements: Implement interactive features with tools like Leaflet or Mapbox to engage viewers.
Workflow Frameworks
Develop a systematic workflow for your mapping projects:
- Planning Phase: Define objectives and target audience.
- Data Preparation: Collect, clean, and normalize your data for consistency.
- Mapping Creation: Design and create the map using your chosen software tools.
- Quality Assurance (QA): Peer review by fellow cartographers for accuracy is critical at this stage.
Quality Control Tips
Maintaining high-quality standards is crucial. Here are effective QA/QC practices:
- Perform Regular Checks: Review map projections and data accuracy against established benchmarks.
- Test Viewer Comprehension: Gather feedback from a sample audience to ensure clarity.
- Document Your Process: Keep detailed records of procedures and decisions for future reference.
Incorporating these strategies and methods will not only refine your mapping skills but will also enhance the clarity and effectiveness of your cartographic products.
Factors to Consider in Choosing Map Projections
Selecting the right map projection is crucial for achieving accurate geographic representation, considering various elements that impact the final product. Here are key factors to keep in mind:
Purpose of the Map
Your map’s intended use significantly dictates the projection choice. For general reference or atlases, you could use compromise projections like the Robinson or Winkel Tripel, as they effectively balance area and shape distortions. On the other hand, if you’re focusing on navigation, consider conformal projections like the Mercator, which preserves angles, making it easier to plot routes.
Area vs. Shape Representation
You must balance area and shape representation based on your mapping needs. If accurate size representation is a priority, use equal-area projections such as the Mollweide or Albers Equal Area Conic. However, if maintaining the correct shape of geographic features is essential, conical projections like the Lambert Conformal Conic may suit your needs better, especially for areas with a larger east-west span.
Distortion Considerations
Understanding the types of distortion your map might encounter is vital. Each projection involves trade-offs; for example, the Mercator projection maintains directional accuracy but significantly distorts land area, particularly near the poles. Always assess how these distortions might affect your map’s usability, particularly in thematic or statistical representations, where data accuracy is paramount.
Conclusion
Choosing the right map projection is essential for effective geographic representation. By understanding the strengths and limitations of various projections you can enhance clarity and accuracy in your maps. Whether you’re focusing on area preservation with the Mollweide projection or prioritizing shape with the Robinson projection your choice will significantly impact the map’s usability.
Remember to consider your specific needs and the intended audience when selecting a projection. This thoughtful approach ensures your maps communicate the intended message clearly while minimizing distortion. With the right projection in hand you can create maps that not only inform but also engage your audience effectively.


