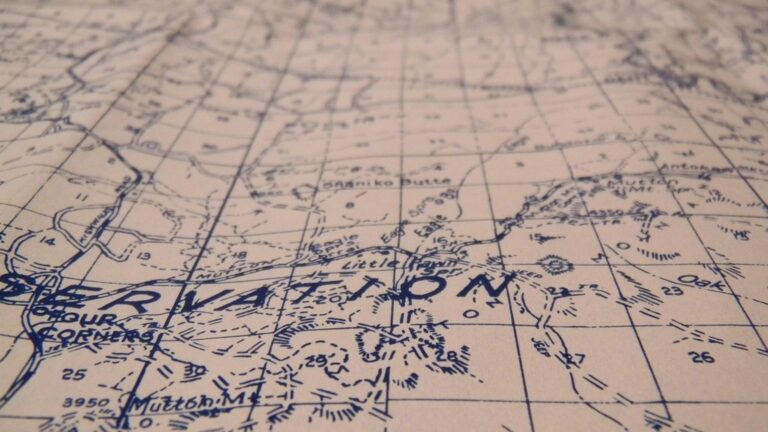
10 Best Historical Map Overlays for GIS Analysis to Reveal Hidden Patterns
Historical map overlays can transform your GIS analysis by providing rich context and revealing patterns over time. By integrating these overlays, you can uncover insights about land use, population shifts, and environmental changes that shaped your area of interest. Discovering the best historical map overlays not only enhances your research but also deepens your understanding of historical narratives.
The Importance of Historical Map Overlays for GIS Analysis
Using historical map overlays in GIS analysis plays a critical role in uncovering insights about spatial changes over time. When you overlay these maps onto current geographic data, you can visualize significant transformations in land use, demographics, and environmental changes.
- Identify Patterns: Historical overlays enable you to recognize patterns that might not be evident in contemporary datasets. For example, you can track urban sprawl by comparing current land use with a historical map from the early 1900s. Tools like ArcGIS and QGIS allow you to easily manipulate these overlays for deeper analysis.
- Contextualize Data: Incorporating historical maps helps contextualize your data. You can understand how population movement and land ownership have evolved, providing critical background for urban planning or environmental studies. Utilizing platforms like Historical GIS will assist in acquiring and layering historical datasets efficiently.
- Support Decision-Making: Historical map overlays empower better decision-making for local governments and planners. By visualizing historical trends, you can inform zoning laws, conservation efforts, and development projects. Leveraging geospatial tools like Google Earth Pro can give you a dynamic view of historical changes as you zoom in on specific regions.
- Enhance Storytelling: These overlays facilitate compelling storytelling in your analysis. They put a narrative spin on data interpretations, making it easier to engage stakeholders. Tools like StoryMapJS can help create interactive presentations that integrate historical maps with narrative text and images.
Incorporating historical map overlays not only enriches your GIS analysis but also equips you with the tools to tell a more comprehensive and meaningful story about the spaces you study.
The Criteria for Selecting the Best Historical Map Overlays
Selecting the best historical map overlays for your GIS analysis involves careful consideration of several essential criteria. These factors ensure that the overlays you choose will be relevant, reliable, and easy to use in your mapping projects.
Relevance to Geographic Area
Relevance is critical when selecting historical map overlays. Choose maps that align closely with the specific geographic area you’re studying. Tools like the David Rumsey Georeferencer can help you rectify historical maps to match modern spatial data accurately. This ensures that the historical maps overlay correctly with current geographic information, enhancing your analysis’s effectiveness.
Quality of Data Sources
Quality of data sources plays a vital role in the integrity of your historical GIS analysis. Use reliable resources such as digitized old maps, census records, travel diaries, land records, and other archival documents. Ensure these data sources have been accurately digitized and verified to maintain a high standard of analysis. Trusted databases like the Library of Congress and National Archives often provide high-quality historical data suitable for GIS applications.
Ease of Integration with GIS Software
Master ArcGIS Pro 3.2 with this comprehensive guide. Learn essential GIS workflows and data management techniques for effective spatial analysis.
Ease of integration with GIS software is essential for a smooth workflow. Opt for historical map overlays that are compatible with your preferred GIS tools, such as ArcGIS or QGIS. Many platforms offer plug-ins or support for importing overlays in common formats like GeoTIFF or shapefile. Check for user-friendly features, such as dynamic mapping adjustments, which facilitate seamless incorporation into your existing mapping projects.
The Best Historical Map Overlays for GIS Analysis
When it comes to GIS analysis, utilizing historical map overlays can significantly enhance your understanding of geographic changes over time. Here are some of the best resources you can tap into for this purpose.
1. Historic USGS Topographic Maps
Enhance your decor with this vintage map reproduction, printed on archival paper with vibrant giclee inks for lasting quality. Arrives ready to frame in standard sizes, showcasing historical character without watermarks.
Historic USGS Topographic Maps are invaluable, offering over 181,000 maps from 1879 to 2006. Scanned and georeferenced, these maps integrate seamlessly with ArcGIS Pro, ArcGIS Online, and ArcGIS Enterprise. You’ll find detailed spatial records that reveal historical land use, transportation routes, and natural features—essential for understanding regional developments.
2. David Rumsey Map Collection
This is a used book in good condition. Enjoy a pre-loved copy with all pages intact and minimal wear.
The David Rumsey Map Collection houses over 116,000 historical maps available online, spanning from the 16th to the 21st century. This collection covers diverse regions and various themes, making it easy for you to import maps into ArcGIS Pro or other GIS software. You’ll uncover rich historical narratives and spatial relationships in your analysis.
3. National Archives Historical Maps
This mid-century map of the Cold War-era Holy Land adds a bold, unique touch to any office or home. Printed on thick, quality paper, this National Geographic map offers trusted, accurate content and iconic cartography.
The National Archives hosts an extensive collection of historical maps, ranging from military to urban planning maps. These maps can often be accessed online, providing expert insights into historical land use and administrative boundaries. They serve as an important resource, especially for governmental and regulatory studies in GIS.
4. OldMapsOnline
OldMapsOnline is a user-friendly platform, allowing you to search for historical maps from various sources worldwide. This resource includes layers which facilitate easy integration with your GIS project. You can visualize changes over time by combining these maps with current geographic data, enhancing your analysis capabilities.
5. The Newberry Library Cartographic Collections
The Newberry Library’s Cartographic Collections offer an impressive selection of maps focusing on North America. With thousands of digitized maps and atlases, you’ll find invaluable resources for historical research. These documents are particularly useful for analyzing demographic and socio-economic changes in specific regions through time.
How to Integrate Historical Map Overlays in GIS Software
Integrating historical map overlays into GIS software can enhance your analysis exponentially. You can follow specific techniques and utilize tools designed to streamline this process.
Tips for Layering Maps Effectively
- Choose the Right Base Layer: You should select a modern map that matches your historical context for optimal alignment. This can significantly ease the georeferencing process.
- Ensure Correct Scale: Use maps that are at comparable scales to maintain consistency. Mismatched scales can distort spatial relationships.
- Manage Transparency Levels: Adjust the transparency of your historical maps to reveal modern layers underneath. This enhances visual comparisons and data readability.
- David Rumsey Georeferencer: This tool is excellent for rectifying historical maps, especially those from the David Rumsey Map Collection. It simplifies the georeferencing process through intuitive user interface design.
- NYPL Map Warper: Utilize this tool to digitally align historical maps with contemporary ones. You can either work on new maps or edit already rectified ones, making it versatile for collaborative projects.
- ArcGIS Pro: Consider using ArcGIS Pro for extensive GIS projects. It has built-in capabilities for both georeferencing and layering historical maps efficiently.
- QGIS: This open-source tool offers robust features for aligning historical maps without incurring additional costs. You can bring in various formats and export your work seamlessly.
Employ these tips and tools in your workflow to enhance your GIS mapping projects with rich historical context.
Case Studies Using Historical Map Overlays
Historical map overlays provide valuable insights when analyzing urban development and environmental changes. Below are two key examples illustrating their practical applications in GIS analysis.
Example 1: Urban Development Analysis
You can utilize the Atlas of Urban Expansion to study urban growth patterns across 30 cities from 1800 to 2014. This project combines historical maps with contemporary satellite imagery, allowing you to calculate metrics such as blocks and roads for different historical periods. You’ll find downloadable data available in tables, PDF pages, and GIS formats, enabling detailed analysis of urban sprawl and infrastructure evolution over time.
Example 2: Environmental Change Studies
You can apply Historical GIS (HGIS) techniques to analyze environmental changes over time. For instance, a study focused on Milan, Italy, employs historical maps to visualize shifts in land use prompted by historical events. This method helps you interpret how environmental factors, such as industrialization or urbanization, have altered landscapes. Furthermore, accessing reliable data sources can enrich your analyses, revealing complex interactions between human activity and environmental change across decades.
Conclusion
Using historical map overlays in GIS analysis opens up a world of insights that can transform your understanding of spatial changes over time. These overlays not only enhance your data interpretation but also provide a richer narrative for your projects. By selecting the right resources and integrating them effectively into your GIS software, you can uncover patterns that reveal the evolution of land use and demographics.
As you explore the recommended overlays and tools, remember that the quality and relevance of your chosen maps are key to successful analysis. Embrace the power of historical context to inform your decision-making and storytelling, making your GIS projects more impactful and engaging.


