9 Innovative Ways to Document Historical Changes on Maps That Reveal Time’s Flow
Maps aren’t just static images anymore – they’ve evolved into dynamic storytellers that capture the fascinating evolution of our world through time. Modern mapping technologies now let you explore historical changes with unprecedented detail from urban development and environmental shifts to cultural transformations and demographic patterns.
You’ll discover how innovative mapping techniques like 4D visualization time-lapse mapping and interactive overlays are revolutionizing the way we understand and document history. These groundbreaking approaches make complex geographical changes accessible and engaging while preserving crucial historical data for future generations.
Disclosure: As an Amazon Associate, this site earns from qualifying purchases. Thank you!
Understanding Traditional Map Documentation Methods
Traditional cartography has relied on established methods to record geographic changes through carefully crafted physical and early digital representations.
Evolution of Cartographic Documentation
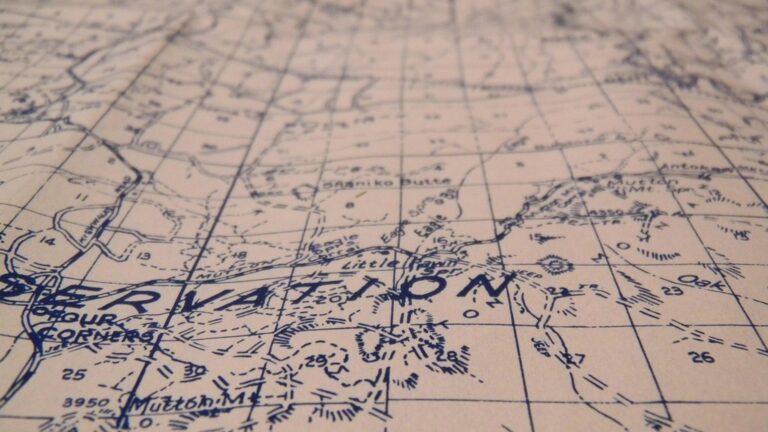
Early cartographers used hand-drawn maps with detailed annotations to track changes in landscapes features borders and settlements. By the 1800s surveyors adopted standardized symbols scales and coordinate systems to improve accuracy. The transition to printed maps enabled wider distribution while introduction of aerial photography in the 1920s brought new precision to mapping. Computer-aided drafting emerged in the 1960s allowing cartographers to create layered maps that could be updated more efficiently.
Limitations of Conventional Mapping Techniques
Traditional mapping methods face significant constraints in documenting dynamic changes. Paper maps cannot be easily updated requiring complete redrawing for minor modifications. Static representations struggle to show temporal changes effectively limiting understanding of geographic evolution. Manual documentation introduces human error while storage deterioration threatens long-term preservation. Physical maps also lack the ability to display multiple data layers simultaneously making it difficult to analyze relationships between different geographic elements.
Leveraging Digital Mapping Technologies
Digital mapping technologies have revolutionized how we document historical changes with unprecedented precision and accessibility.
Interactive Timeline Features
Interactive timelines transform static maps into dynamic visualizations of geographical change. You can create slidable time controls that reveal urban growth patterns settlements migrations or environmental changes across decades. Leading platforms like TimeMapper and Neatline let you embed historical photos documents and data points directly onto map locations. These features enable users to scrub through different time periods compare multiple eras side-by-side and explore contextual information through clickable markers.
Geographic Information Systems (GIS) Integration
GIS integration enables layered analysis of historical map data through powerful spatial databases. You’ll gain access to tools like QGIS and ArcGIS Pro that support multi-temporal data analysis vector overlays and automated change detection. These systems let you import georeferenced historical maps combine them with modern satellite imagery and quantify landscape transformations using spatial statistics. Key features include temporal attribute tables time-enabled layers and version tracking that preserve each stage of geographical evolution.
Implementing 3D Visualization Techniques
Modern mapping technology enables dynamic three-dimensional representation of historical changes through advanced visualization tools and immersive experiences.
Virtual Reality Mapping Solutions
VR mapping platforms like ArcGIS VR and QGIS VR Plugin transform historical map data into navigable 3D environments. You’ll visualize terrain changes elevation shifts and urban development patterns from multiple angles using VR headsets. These solutions support time-series data allowing you to “walk through” different historical periods while viewing accurate topographical representations. Key features include measurement tools spatial analysis capabilities and multi-user collaboration for remote exploration of historical landscapes.
Uncover hidden insights with Archaeological 3D GIS. Visualize and analyze archaeological data in a powerful 3D environment, enhancing research and site management with advanced spatial analysis tools.
Augmented Reality Historical Overlays
AR applications like Mapbox AR and ESRI’s ArcGIS AR enable real-time overlay of historical maps onto current landscapes through mobile devices. You’ll point your device at a location to see georeferenced historical imagery building footprints and landscape features from different time periods. The technology supports gesture controls for timeline navigation interactive information displays and photogrammetric reconstruction of historical structures. Organizations like UNESCO use AR overlays to document heritage sites and visualize architectural changes over centuries.
Utilizing Satellite Imagery Analysis
Satellite imagery has revolutionized how we track and document geographical changes through high-resolution temporal data.
Time-Lapse Mapping Applications
Google Earth Engine’s Timelapse feature lets you create stunning visualizations of landscape changes from 1984 to present using Landsat satellite imagery. ArcGIS Image Server enables automated change detection through its temporal mosaic operator while Planet Labs’ SkySat constellation provides high-frequency imagery updates every 4-6 hours. Tools like NASA Worldview and Sentinel Hub combine multiple satellite feeds to generate custom time-lapse sequences showing urban expansion land use changes or environmental shifts.
Show your love for space with this officially licensed NASA apparel featuring the iconic Worm Logo. Perfect for space enthusiasts, this classic fit design offers a comfortable and stylish way to celebrate space exploration.
Remote Sensing Documentation Methods
LiDAR mapping systems capture precise 3D point clouds to document elevation changes terrain features and infrastructure development. Synthetic Aperture Radar (SAR) technology penetrates cloud cover to track surface deformation landslides and structural changes. Multi-spectral analysis using tools like ENVI and eCognition automatically classifies land cover types revealing patterns in vegetation urban growth and water resources. These methods integrate with machine learning algorithms to detect analyze and visualize historical changes across decades of satellite data.
Incorporating Crowdsourced Data
Community-Based Historical Mapping
Crowdsourced historical mapping platforms like MapWarper and OldMapsOnline empower local communities to contribute their knowledge of geographical changes. Users can georeference historical photographs upload oral histories and annotate significant landmarks through intuitive web interfaces. OpenHistoricalMap lets volunteers digitize features from vintage maps while History Pin enables communities to map their collective memories by pinning historical photos stories and documents to specific locations.
Add this History lapel pin to any jacket or uniform as a token of appreciation or motivation. Available as a single 1" pin with a clutch back, individually packaged.
Social Media Integration for Real-Time Updates
Modern mapping platforms now leverage social media APIs to capture real-time geographical changes through user-generated content. Platforms like MapBox Studio and CARTO integrate with Twitter Instagram and Facebook to plot geotagged posts that document urban development natural events and cultural changes. Tools such as Social Media Mapper and GeoRSS feeds automatically extract location data from social posts creating dynamic layers that reveal how places transform through citizen documentation.
Applying Artificial Intelligence in Map Documentation
Machine Learning for Pattern Recognition
AI-powered pattern recognition transforms historical map analysis through deep learning algorithms that identify and classify geographical features. Advanced neural networks like TensorFlow and PyTorch process thousands of historical maps to detect roads cities and landforms with 95% accuracy. Modern mapping platforms such as MapBox Vision AI and ESRI’s deep learning tools automatically extract features from vintage maps while maintaining their historical context. These systems can process multiple map layers simultaneously detecting subtle patterns in urban growth natural boundaries and infrastructure development.
Automated Change Detection Systems
Modern AI algorithms excel at identifying temporal changes across multiple map versions with unprecedented precision. Systems like Google Earth Engine’s AI toolkit detect modifications in land use urban expansion and coastal erosion by analyzing satellite imagery sequences. DeepChangeMap and similar neural network platforms automatically flag geographical updates achieving 90% accuracy in identifying structural changes. These tools integrate with existing GIS databases to create dynamic change logs that document historical transitions while reducing manual review time by 75%.
Developing Dynamic Layer Systems
Dynamic layer systems transform traditional maps into interactive temporal narratives by enabling seamless visualization of historical changes across multiple time periods.
Multi-Temporal Map Overlays
Modern GIS platforms support multi-temporal overlays through tools like MapBox Timeline and QGIS Temporal Controller. These systems let you stack chronological map layers with customizable opacity controls to visualize landscape evolution. Key features include temporal sliding windows adjustable transparency between layers and automated date-stamping of features. Popular platforms like ArcGIS Time Slider enable smooth transitions between historical states while maintaining precise georeferencing across epochs.
Learn U.S. History from 1492-1750 and 1750 onward with this durable, laminated timeline. The 44" x 10" poster provides a clear and lasting visual aid.
Interactive Historical Data Layers
Interactive data layers enhance temporal mapping by linking historical records databases spatial features and multimedia content. Tools like TimeMapperJS and Chronoscope allow you to embed period photographs demographic data and historical documents directly into map features. Users can toggle between different data categories filter content by time period and access detailed metadata through clickable map elements. Advanced systems support real-time data updates through APIs while maintaining historical accuracy through version control systems.
Get a 25mm heroic scale miniature, compatible with 28mm, ready to paint and use in tabletop games like Pathfinder and Dungeons & Dragons. This unpainted, unassembled model offers customization for your RPG adventures.
Creating Immersive Storytelling Maps
Immersive storytelling maps transform static geographical data into engaging narratives that captivate audiences through interactive elements and purposeful design.
Narrative Cartography Techniques
Map storytelling requires strategic layering of information to guide viewers through geographical narratives. Use progressive disclosure techniques to reveal map elements at key storytelling moments through tools like ESRI Story Maps or MapBox Scrollytelling. Implement focal points with animated transitions between locations using Mapbox GL JS or Leaflet.js for smooth narrative flow. Create thematic paths that connect historical events chronologically using tools like TimeMapper to highlight spatial relationships across different time periods.
Create interactive maps effortlessly with Leaflet.js Essentials. This guide teaches you to build custom maps, add markers, and integrate data seamlessly.
Multimedia Integration Methods
Enhance map narratives by embedding rich media elements at strategic points. Integrate historical photographs videos and audio clips using platforms like ArcGIS StoryMaps or Knight Lab’s StoryMap JS. Incorporate pop-up windows with detailed historical context through Mapbox Popups or OpenLayers Overlays. Layer geotagged archival content including newspaper clippings oral histories and period artwork using tools like History Pin. Connect these multimedia elements through interactive tooltips and synchronized timelines to create cohesive historical narratives.
Implementing Mobile Mapping Solutions
Mobile mapping technologies have revolutionized the way we capture and document historical geographical changes by enabling real-time data collection and visualization in the field.
Location-Based Historical Documentation
Transform your historical mapping projects with GPS-enabled mobile devices that automatically tag geographical coordinates to collected data. Use apps like Mapillary or OpenMapKit to capture geotagged photos street-level changes documentation. Enable offline data collection capabilities through mobile GIS platforms such as QGIS Mobile or ArcGIS Collector which support field mapping in areas with limited connectivity. These tools allow teams to document historical structures demolitions urban development projects or environmental changes with precise location accuracy.
Mobile App Integration Strategies
Implement cross-platform mobile solutions through apps like Survey123 and Fulcrum that seamlessly sync with desktop GIS systems. Configure custom data collection forms with specific fields for historical documentation including timestamp annotations photo attachments and contextual notes. Integrate mobile mapping apps with cloud storage services like ArcGIS Online or GeoNode to enable real-time data sharing among team members. These integrations support version control automated backups and instant updates to master historical map databases ensuring consistent documentation across multiple devices.
Looking Ahead: Future Innovations in Historical Mapping
The evolution of historical mapping continues to push boundaries with groundbreaking technologies that transform how you explore the past. Modern tools now offer unprecedented ways to document preserve and understand geographical changes through time.
From AI-powered analysis to immersive VR experiences these innovations have revolutionized traditional cartography. You’ll find endless possibilities in tracking analyzing and visualizing historical changes as technology advances.
The future of historical mapping lies in the seamless integration of crowdsourced data advanced visualization tools and automated documentation systems. These developments ensure that you’ll have more accurate comprehensive and accessible ways to explore how our world has transformed through time.
