9 Creative Approaches to Depicting Territorial Shifts That Transform Digital Maps
Mapping territorial changes through history demands more than just drawing new borders on paper – it requires innovative ways to help viewers truly grasp how lands and powers have shifted over time. Today’s digital tools and creative visualization techniques have revolutionized how we can illustrate complex geopolitical changes, from interactive timelines to 3D terrain models.
You’ll discover how cutting-edge methods like augmented reality maps, data-driven animations and immersive virtual experiences are transforming the way we understand and present territorial evolution. Whether you’re a historian, educator or geography enthusiast these modern approaches make it easier than ever to bring shifting boundaries and changing sovereignties to life in compelling new ways.
Disclosure: As an Amazon Associate, this site earns from qualifying purchases. Thank you!
Understanding The Importance Of Territorial Shift Visualization
Impact On Historical Documentation
Territorial shift visualization serves as a crucial tool for preserving and understanding historical transitions. Advanced mapping techniques now allow historians to track boundary changes across multiple time periods with unprecedented accuracy. Digital archives benefit from interactive maps that showcase border modifications colonial expansions and political reorganizations. These visualizations help researchers identify patterns in territorial evolution connect demographic shifts to geographical changes and validate historical claims through spatial data analysis.
P.S. check out Udemy’s GIS, Mapping & Remote Sensing courses on sale here…
Role In Modern Geopolitical Analysis
Modern geopolitical analysts rely on territorial shift visualization to predict and understand global power dynamics. Real-time mapping tools enable experts to track ongoing territorial disputes border conflicts and regional alliances. Digital visualization platforms help identify strategic chokepoints resource-rich zones and potential areas of conflict. Analysts use these tools to assess migration patterns evaluate economic corridors and monitor changing spheres of influence. Machine learning algorithms now enhance these visualizations by detecting subtle patterns in territorial movements and predicting future geopolitical scenarios.
Mapping Dynamic Boundaries Through Color Theory
Color theory offers powerful tools for visualizing complex territorial transitions and boundary changes on maps while maintaining clarity and user engagement.
Using Color Gradients To Show Transition
Color gradients create intuitive visual representations of territorial shifts between regions. Implement smooth transitions from one dominant hue to another to show gradual changes in sovereignty or influence. For instance, blend blue to green to illustrate the merger of two political entities or red to yellow to demonstrate population migration patterns. Use opacity variations to indicate the intensity of change while maintaining geographic reference points visible beneath the gradient overlay.
Implementing Strategic Color Psychology
Select colors based on established psychological associations to enhance map comprehension. Choose blue tones to represent stability or established territories red for areas of conflict or disputed regions and green for newly formed or emerging boundaries. Apply complementary colors for contrasting powers or competing claims while using analogous color schemes to show allied regions or cultural continuity. Consider color blindness accessibility by avoiding problematic combinations like red-green distinctions.
Animating Geographic Changes Over Time
Animation breathes life into static territorial maps by illustrating the dynamic nature of geographic boundaries across different time periods.
Interactive Timeline Techniques
Interactive timelines transform complex territorial shifts into engaging user experiences. Modern GIS platforms like QGIS Timeline and ArcGIS Time Slider enable users to scrub through different periods with precision control. You can enhance these visualizations by implementing playback controls speed adjustment features and timestamp indicators. Leading platforms now support time-enabled layers that automatically update based on temporal queries allowing seamless integration of historical data with modern mapping capabilities.
Motion-Based Territory Evolution
Motion-based animations create fluid visualizations of territorial changes through morphing and transition effects. Specialized tools like MapBox GL JS and D3.js enable smooth boundary transformations that show gradual shifts rather than abrupt changes. You can implement fade transitions for disputed territories pulsing effects for active conflicts and directional flows for migration patterns. These dynamic elements help viewers track the evolution of boundaries while maintaining spatial context throughout the animation sequence.
Incorporating 3D Elements For Spatial Context
Adding three-dimensional elements to territorial shift visualization enhances depth perception and improves understanding of geographic relationships.
Layered Elevation Models
Digital Elevation Models (DEMs) transform flat territorial maps into dynamic 3D landscapes using height data from sources like USGS and SRTM. You’ll achieve better spatial context by stacking vector layers on terrain models in tools like ArcGIS Pro or QGIS 3D. Combine topographic data with boundary changes to show how natural features influence territorial divisions. This approach highlights the relationship between terrain characteristics like mountain ranges or river valleys and historical border placements.
Volumetric Data Representation
Modern GIS platforms enable volumetric visualization of territorial changes through voxel-based modeling. You can represent population density variations power spheres of influence or resource distribution in three-dimensional space using tools like ArcGIS Voxel Layer or Cesium Ion. This technique adds depth to traditional boundary lines by displaying the intensity of territorial control through vertical extrusion. Apply transparency gradients to show overlapping zones of influence while maintaining clear sight lines to underlying geographic features.
Understand cesium ion recombination with this research. It offers in-depth analysis and valuable insights into volume recombination processes.
Leveraging Digital Technology For Interactive Displays
Digital technology transforms static territorial maps into dynamic interactive experiences that engage users through intuitive interfaces and immersive visualization methods.
Touch-Screen Territory Manipulation
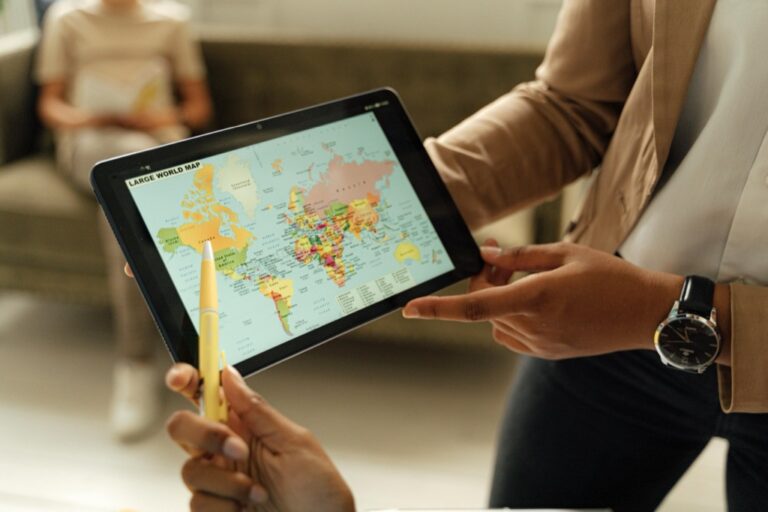
Touch-screen interfaces revolutionize how users interact with territorial shift data through pinch-to-zoom gestures drag-and-drop boundary adjustments and multi-touch timeline controls. Leading platforms like MapTiler and Leaflet.js enable fluid territory manipulation with features such as boundary highlighting instant area calculations and real-time coordinate display. Users can swipe between different historical periods trace disputed borders and create custom territorial scenarios through simple touch gestures that make complex geographical data accessible to diverse audiences.
Create interactive maps effortlessly with Leaflet.js Essentials. This guide teaches you to build custom maps, add markers, and integrate data seamlessly.
Augmented Reality Applications
AR apps transform physical maps into dynamic 3D visualizations using platforms like ARKit and Vuforia. Mobile devices overlay historical boundaries population data and territorial changes onto real-world maps through camera recognition technology. Popular tools like ESRI’s ArcGIS AR and Google’s Earth AR enable users to explore territorial shifts by walking through virtual landscapes examining boundary changes from multiple angles and accessing location-specific historical data. These applications create immersive learning experiences that bridge the gap between digital mapping and physical geography education.
Create augmented reality apps using Unity, ARCore, ARKit, and Vuforia. This guide provides practical skills to bring your AR projects to life.
Utilizing Data Visualization Techniques
Modern data visualization methods transform complex territorial data into clear visual insights using advanced analytical tools and statistical mapping approaches.
Heat Maps And Density Plots
Heat maps reveal territorial influence through color-coded intensity gradients highlighting population concentrations border activity or resource distribution. Using tools like QGIS Heatmap plugin you’ll create intuitive visualizations that show density patterns across regions. Popular platforms such as Kepler.gl enable dynamic heat mapping with customizable color schemes radius settings and opacity levels to represent territorial pressure points effectively. These visualizations help identify areas of concentrated activity hotspots and zones of overlapping territorial claims.
See yourself clearly with The Looking Glass. Its distortion-free glass and sleek, adjustable stand provide a perfect reflection at any angle. Enjoy a durable and stylish addition to your vanity or desk.
Pattern-Based Territory Recognition
Pattern recognition algorithms detect and classify territorial boundaries based on recurring spatial features demographic trends and historical movement patterns. You’ll leverage machine learning tools like TensorFlow’s object detection APIs to identify border patterns from satellite imagery. Modern GIS platforms including ArcGIS Pro’s spatial pattern analysis tools enable automatic detection of natural boundaries administrative divisions and cultural territories. These systems process multiple data layers to recognize complex territorial patterns that might not be apparent through traditional mapping methods.
Build real-world AI projects with this guide to deep learning. Learn practical computer vision techniques using Python, Keras, and TensorFlow for cloud, mobile, and edge applications.
Integrating Multimedia Elements
Modern mapping platforms now allow for rich multimedia integration to create immersive territorial visualization experiences that engage multiple senses.
Sound-Enhanced Territorial Changes
Audio elements transform territorial shift visualization through strategic sound design. Geographic Information Systems (GIS) like ArcGIS Pro support audio embedding enabling conflict zones to play battlefield sounds while peaceful transitions trigger gentle ambient effects. Platforms such as MapBox GL JS incorporate Web Audio API for directional sound cues that indicate boundary movement direction. Sound mixing tools like Audacity help create custom territorial audio signatures differentiating conquest expansion peaceful treaties or diplomatic exchanges.
Record and edit high-quality audio with Audacity. This free, open-source software offers powerful multi-track editing and a wide range of effects for professional sound.
Video Overlay Methods
Video integration enhances territorial visualization through dynamic content overlays. QGIS Timeline supports MP4 embedding to show historical footage alongside changing boundaries while Mapbox Studio enables real-time video streams of current border situations. Leading platforms incorporate Picture-in-Picture APIs to display contextual video documentation of territorial negotiations military campaigns or peace treaties. Tools like ffmpeg facilitate video compression optimization ensuring smooth playback across different devices without compromising map performance.
Implementing Innovative Artistic Approaches
Abstract Territorial Representations
Transform complex territorial data into striking abstract art using geometric shapes color fields and symbolic elements. Create minimalist representations that capture territorial shifts through non-literal visual elements like overlapping circles concentric patterns and gradient flows. Use platforms like Adobe Illustrator or Figma to design abstract map compositions that represent boundary changes through metaphorical visual language. Incorporate artistic principles like rhythm balance and contrast to convey geopolitical transitions in an emotionally resonant way.
Mixed Media Visualization
Combine traditional art materials with digital mapping to create unique territorial visualizations. Layer hand-drawn elements watercolor textures and collage components over base maps using tools like Photoshop or Procreate. Integrate physical media like ink washes relief prints or cut paper with GIS data to produce hybrid visualizations. Popular techniques include screen-printing geographic data onto fabric creating embossed territorial reliefs and building multimedia installations that merge analog and digital mapping methods.
Combining Traditional And Digital Methods
The integration of conventional cartography with modern digital tools creates powerful new possibilities for depicting territorial changes.
Hybrid Mapping Techniques
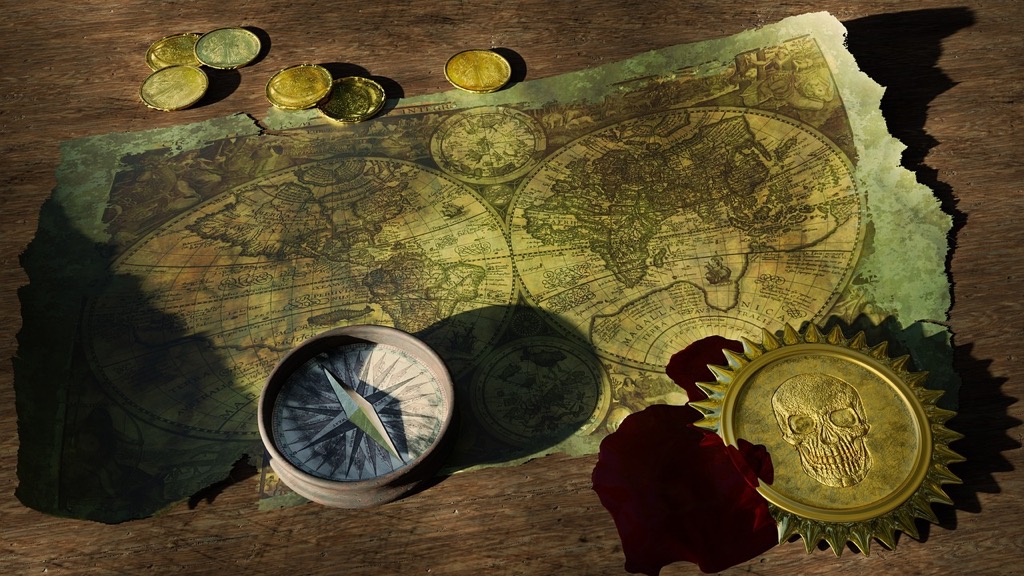
Blend traditional hand-drawn elements with digital mapping software to create unique visualizations. Use paper sketches as base layers in GIS programs like QGIS or ArcGIS to maintain artistic qualities while adding precise geospatial data. Incorporate watercolor textures or pen-and-ink techniques through digital scanning then georeference them to align with modern coordinate systems. This approach combines the warmth of manual artistry with the accuracy of digital tools.
Blended Media Solutions
Integrate multiple visualization methods through layered approaches using mixed media techniques. Combine physical relief models with projected digital overlays to create dynamic 3D presentations. Use transparent overlays on printed maps to show temporal changes while maintaining digital backups for easy editing. Implement augmented reality markers on traditional maps to enable interactive digital content viewing through mobile devices. This fusion creates engaging presentations that leverage both tactile and digital advantages.
Creating User-Centric Interactive Experiences
Interactive mapping experiences transform users from passive viewers into active participants in territorial exploration. Here’s how modern platforms enable personalized engagement with geographic data.
Customizable View Options
Digital mapping platforms now offer users unprecedented control over their viewing experience. Toggle between satellite imagery base maps historical overlays or terrain views with a single click. Adjust transparency levels to compare different time periods simultaneously and filter data layers to focus on specific aspects like population density economic zones or political boundaries. These customization options let users tailor their map viewing experience to match their research needs or learning style.
Participatory Mapping Tools
Modern GIS platforms enable direct user contribution through intuitive drawing tools and data input forms. Users can mark disputed territories add historical annotations or create alternative boundary scenarios through point-and-click interfaces. Platforms like OpenStreetMap and MapWarper allow collaborative mapping where users contribute local knowledge validate territorial claims and crowdsource historical boundary information. These participatory tools transform static maps into living documents that capture diverse perspectives on territorial changes.
Looking Ahead: Future Trends In Territory Visualization
Creative approaches to territorial shift visualization continue to evolve with emerging technologies and innovative artistic methods. These advancements are reshaping how you’ll interact with and understand geographic changes throughout history.
As digital tools become more sophisticated you’ll see an increasing blend of traditional cartography with cutting-edge visualization techniques. The future promises even more immersive experiences through virtual reality mapping mixed media presentations and AI-powered analytical tools.
Whether you’re a historian educator or geography enthusiast these developments will make territorial shifts more accessible engaging and comprehensible than ever before. The fusion of art technology and geographical data opens new possibilities for understanding our ever-changing world.


