10 Historical vs Modern Cartography Styles That Changed Map Making Forever
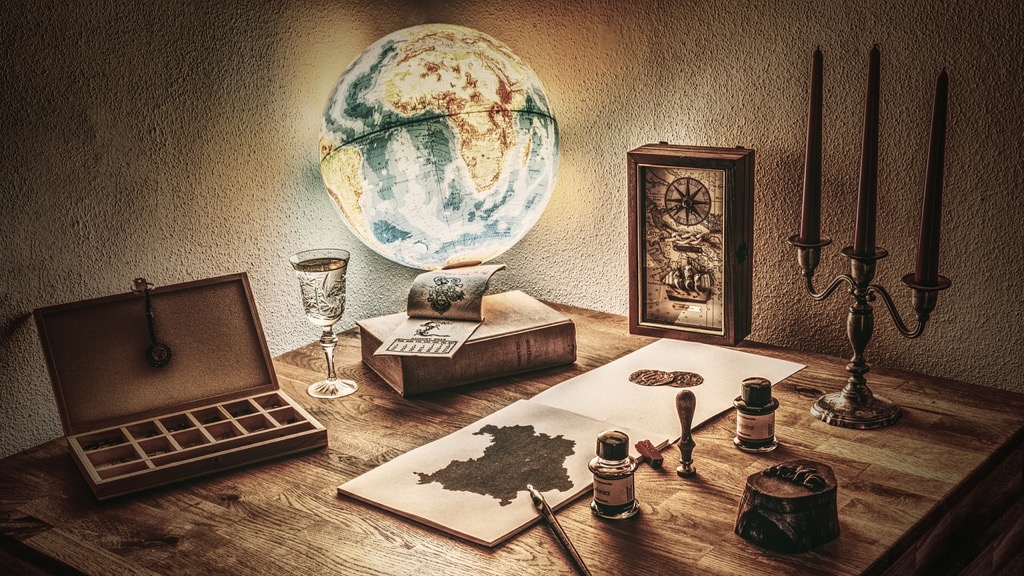
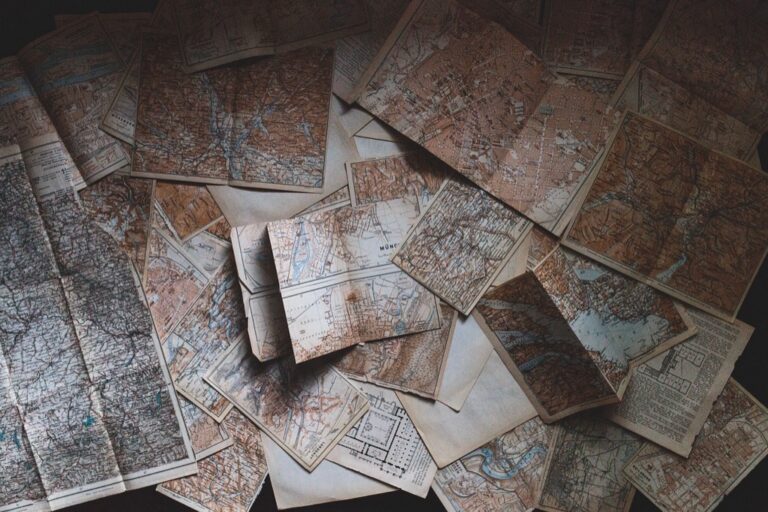
Maps tell stories that span centuries of human exploration and technological advancement. From the ornate hand-drawn maps of ancient cartographers to today’s precision digital mapping systems you’ll find a fascinating evolution in how we’ve captured our world. While historical maps combined artistry with geographical knowledge featuring decorative elements like sea monsters and elaborate compass roses modern cartography emphasizes accuracy functionality and real-time data.
Modern satellite imagery and GPS technology have transformed how you interact with maps making them dynamic tools rather than static representations. Yet there’s an undeniable charm in historical maps that modern versions often lack despite their superior accuracy. Both styles serve as windows into their respective eras showing not just physical landscapes but also the technological capabilities and cultural perspectives of their times.
Disclosure: As an Amazon Associate, this site earns from qualifying purchases. Thank you!
Understanding The Evolution Of Map Making Through Time
Early cartographers relied on celestial navigation tools like astrolabes and sextants to create their first accurate maps in the 15th century. These handcrafted maps combined mathematical precision with artistic elements featuring detailed coastlines sea monsters and ornate compass roses.
The Scientific Revolution brought significant changes through triangulation methods and improved measuring instruments in the 17th century. Cartographers began using more standardized symbols and projection techniques leading to maps that better represented Earth’s spherical nature.
The Industrial Revolution introduced lithographic printing enabling wider map distribution and standardization. This period saw the emergence of topographic mapping with contour lines and elevation data becoming standard features.
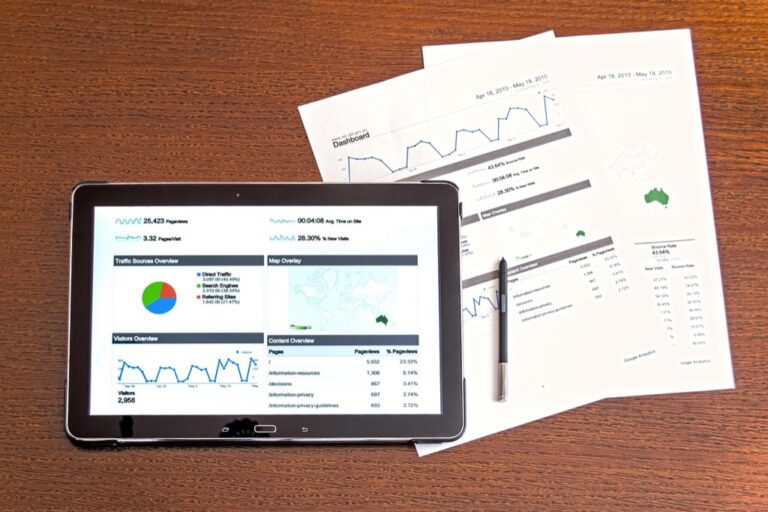
Digital technology transformed mapmaking in the late 20th century. Geographic Information Systems (GIS) software replaced hand drawing while satellite imagery provided unprecedented accuracy. Modern maps now integrate real-time data GPS coordinates and interactive layers making them dynamic tools rather than static representations.
| Era | Key Innovation | Impact on Accuracy |
|---|---|---|
| 15th Century | Celestial Navigation | ±100 miles |
| 17th Century | Triangulation | ±10 miles |
| 19th Century | Lithographic Printing | ±1 mile |
| 20th Century | Satellite Technology | ±1 meter |
Traditional Cartographic Methods And Tools
Hand-Drawn Techniques And Materials
Cartographers relied on specialized tools like compasses dividers protractors and T-squares to create precise hand-drawn maps. India ink quills and high-quality vellum or parchment served as primary materials while watercolors added subtle terrain distinctions. Masters used techniques like cross-hatching for shading relief features stippling for showing varying densities and careful line work to depict coastlines rivers and political boundaries.
Measure angles accurately with this set of 30 clear, 6-inch protractors. Ideal for students and technical drawing, these protractors feature easy-to-read degree markings in both inches and centimeters.
Artistic Elements In Historical Maps
Historical maps blended scientific accuracy with decorative artistry through elaborate compass roses mythological figures and ornate cartouches. Mapmakers enhanced their works with hand-painted illustrations of sea monsters indigenous animals and sailing ships in unexplored areas. Color played a crucial role with gold leaf highlighting important cities vermillion marking political boundaries and varying blue hues depicting ocean depths.
Historical Map Elements And Symbolism
Religious And Mythological Influences
Early maps frequently incorporated religious iconography and mythological elements reflecting medieval and Renaissance worldviews. Cartographers added biblical scenes angels dragons and sea monsters to represent both known dangers and unexplored territories. Jerusalem often appeared at the center of medieval mappae mundi while the Garden of Eden was commonly depicted at the eastern edge. Paradise was typically illustrated at the top of T-O maps symbolizing the medieval Christian cosmos with Asia Europe and Africa divided by T-shaped waters.
Decorative Cartouches And Compass Roses
Cartouches served as elaborate frames for map titles legends and dedications featuring intricate baroque designs with scrollwork garlands and allegorical figures. Compass roses evolved from simple directional indicators into ornate artistic elements combining practical function with decorative appeal. These roses typically displayed 32 directional points with gold leaf highlighting the cardinal directions while incorporating nautical symbols maritime imagery and wind directions. Cartographers often personalized their compass roses making them unique signatures of their work.
Modern Digital Cartography Technologies
Modern cartography leverages advanced digital tools to create precise interactive maps that integrate real-time data and dynamic visualization capabilities.
GIS And Satellite Mapping Systems
Geographic Information Systems (GIS) revolutionize map creation by layering multiple data types including demographics traffic patterns and environmental information. These systems process high-resolution satellite imagery from platforms like Landsat and Sentinel to generate detailed land-use maps. Modern GIS tools like ArcGIS QGIS and MapInfo enable cartographers to analyze spatial relationships create custom visualizations and integrate real-time data feeds for applications ranging from urban planning to disaster response.
3D Terrain Modeling And Visualization
Digital elevation models (DEMs) transform flat maps into dynamic 3D landscapes using LiDAR and photogrammetry data. Software platforms like Unity3D SketchUp and ArcGIS Pro render detailed topographic features allowing users to explore terrain from any angle. These tools support advanced analysis of slope aspects and watersheds while enabling immersive visualizations for applications in urban development environmental assessment and virtual reality mapping experiences.
Data Collection Methods: Then And Now
Traditional Surveying Techniques
Traditional cartographers relied on manual field surveys that combined mathematical precision with direct observation. They used theodolites to measure horizontal and vertical angles along with chains and tapes for distance measurements. Triangulation served as the primary method for determining positions by creating networks of triangles from known reference points. Surveyors also employed plane tables for direct sketching in the field complete with distance calculations and angular measurements. These time-intensive methods required teams of skilled workers to gather data across challenging terrain while maintaining accuracy through careful documentation and cross-checking.
Modern Remote Sensing And GPS
Today’s cartographers leverage satellite technology and digital sensors to collect vast amounts of geographic data remotely. LiDAR systems capture precise 3D terrain data using laser pulses while multispectral satellite imagery provides detailed land cover information. GPS receivers with RTK capabilities now achieve centimeter-level accuracy in real-time positioning. Automated drones equipped with photogrammetric cameras collect high-resolution imagery and create detailed orthomosaics. Modern data collection combines these technologies through integrated GIS platforms that process multiple data streams simultaneously. Cloud computing enables real-time sharing and processing of massive geographic datasets across global teams.
Get precise location data on your Bluetooth-enabled device with the Garmin GLO 2. This receiver combines GPS and GLONASS for accuracy and offers up to 13 hours of battery life on a single charge.
Visual Design Elements In Historical Maps
Color Usage And Artistic Embellishments
Historical maps showcased vibrant color palettes created from natural pigments like vermilion cinnabar indigo and malachite. Cartographers applied these colors using precise techniques to differentiate between land masses bodies of water and political boundaries. Decorative elements featured elaborate illustrations of sea monsters mythological figures and ornate compass roses that filled empty spaces. Mountain ranges appeared as artistic clusters of peaks while seas contained detailed ships and sea creatures. The colors remained remarkably preserved in many medieval and Renaissance maps through the use of high-quality vellum and mineral-based pigments.
Create custom, archival paints with these 20 natural earth and mineral pigments, free from toxins and additives. Easily mix them with binders to craft oil, watercolor, and more, while enjoying their exceptional lightfastness and sustainable packaging.
Typography And Label Placement
Historical maps displayed distinctive typography that combined functionality with artistic merit. Cartographers used decorative calligraphy with flourished letterforms varying in size to indicate hierarchy of place names. Labels followed curved paths along coastlines and rivers creating visual flow while major cities received ornate cartouches with gilded borders. Text placement required careful planning as cartographers hand-lettered each label using specialized inks and precise penmanship. The orientation of text often varied with labels running in multiple directions to maximize space usage while maintaining readability.
Learn modern calligraphy and hand lettering with this beginner-friendly guide. It features clear instructions and helpful exercises to develop your skills.
Contemporary Map Design Principles
Minimalist Aesthetics
Modern digital maps embrace a “less is more” philosophy focusing on clarity and user experience. Clean typography with sans-serif fonts like Helvetica and Open Sans creates instant readability while muted color palettes reduce visual noise. Essential map elements appear in a hierarchy of importance with subtle drop shadows and transparency effects guiding the user’s attention. Map features use simplified iconography that scales well across devices representing points of interest roads and landmarks with standardized symbols.
Interactive Features And Layers
Interactive maps leverage dynamic elements that respond to user input through zooming panning and filtering capabilities. Base layers provide foundational geographic data while toggle-able overlay layers display specific information like traffic patterns demographics or environmental data. Key interactive features include:
- Custom data filtering options
- Real-time location tracking
- Pop-up information windows
- Layer opacity controls
- Distance measurement tools
- Customizable legend displays
These features allow users to explore spatial relationships and access detailed information while maintaining a clean interface.
Accuracy And Precision Comparisons
Historical Measurement Limitations
Early cartographers faced significant challenges in achieving accurate measurements due to technological constraints. Celestial navigation tools like astrolabes provided latitude readings accurate only within 1-2 degrees while longitude calculations remained problematic until the invention of marine chronometers in 1761. Medieval maps often distorted distances by 15-30% due to limited surveying capabilities. Common errors stemmed from:
This 2-pack of digital stopwatches features a large display for easy time, date, and alarm viewing. Precisely measure events with 1/100 second split timing, ideal for coaches, referees, and athletes.
- Reliance on travelers’ accounts & dead reckoning
- Incomplete understanding of Earth’s curvature
- Basic measuring tools like chains & compasses
- Weather-dependent observation methods
- Sub-meter accuracy with RTK-GPS systems
- Satellite imagery at 31cm resolution
- Digital elevation models accurate to 10cm
- Real-time error correction capabilities
- Automated quality control processes
| Technology | Accuracy Range |
|---|---|
| RTK-GPS | 1-2cm |
| LiDAR | 1-5cm |
| Satellite Imagery | 31-50cm |
| Digital Maps | 1-3m |
Cultural Influences On Map Making
Historical Political And Social Contexts
Historical maps reflected dominant cultural beliefs power structures through selective representation. Medieval European maps placed Jerusalem at the center mirroring Christian worldviews while Islamic cartographers oriented maps with south at the top. Chinese maps emphasized the Middle Kingdom’s centrality using cultural symbols like dragons and phoenixes. Colonial powers manipulated map projections to exaggerate their territories making Europe appear larger than Africa. Royal cartographers included elaborate decorations coats of arms and dedicatory cartouches to honor their patrons displaying clear political hierarchies through visual elements.
Modern Global Standardization
Today’s digital mapping follows internationally standardized conventions driven by technical requirements and user accessibility. The Universal Transverse Mercator system provides consistent coordinate references while ISO standards govern symbology and data formats. Web mapping platforms like Google Maps and OpenStreetMap use familiar visual languages that transcend cultural boundaries. Modern maps prioritize functional design over cultural expression focusing on accurate data representation and universal usability. Standardized icons colors and labeling systems enable global comprehension while respecting local naming conventions through multilingual support.
The Future Of Cartographic Design
The journey from historical to modern cartography showcases humanity’s remarkable progress in mapping our world. While historical maps charm us with their artistic flair and cultural significance modern cartography empowers you with precise digital tools and real-time data.
Today’s mapping technologies offer unprecedented accuracy and functionality but they still draw inspiration from the artistic principles of their predecessors. You’ll find that both styles serve distinct purposes – historical maps as windows into past worldviews and modern maps as dynamic tools for navigation and analysis.
As mapping technology continues to evolve you can expect even more innovative features combining aesthetic appeal with practical functionality. The future promises exciting developments in augmented reality mapping personalized navigation and immersive 3D visualizations that’ll transform how you interact with geographic information.


