10 Maps in Social Change Movements That Revealed Hidden Power Structures
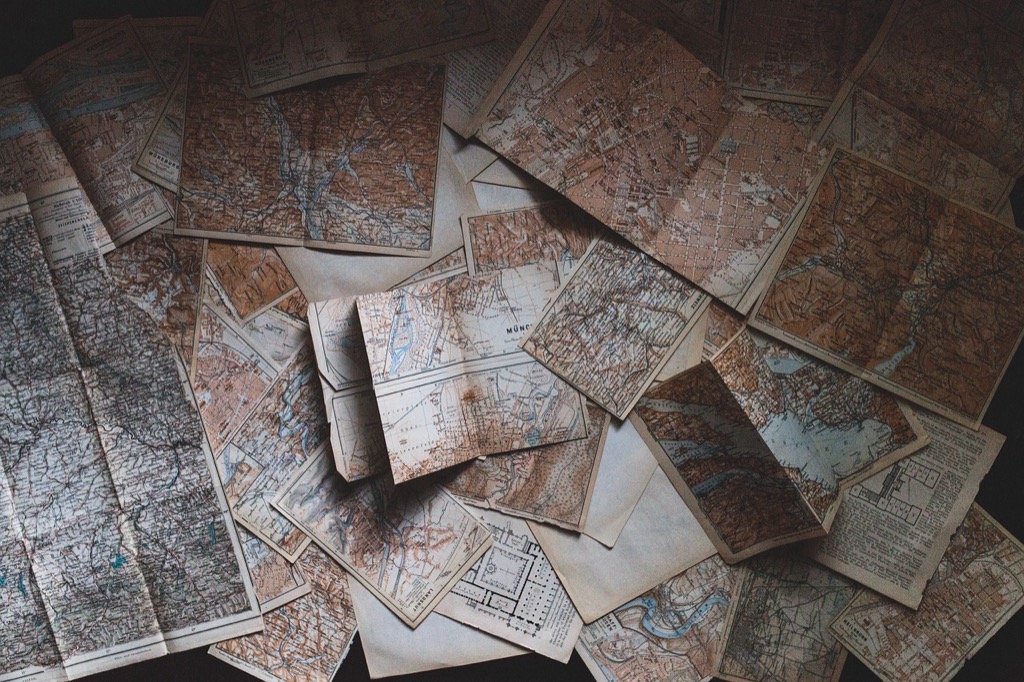
Maps have emerged as powerful tools for driving social change far beyond their traditional role of showing directions and boundaries. From highlighting environmental justice issues to exposing racial inequalities in urban planning these visual representations help activists tell compelling stories that spark action and awareness. Whether you’re organizing grassroots movements or advocating for policy changes understanding how to leverage maps can amplify your message and create lasting impact.
Digital mapping technology has revolutionized how social movements document analyze and communicate their causes to the world. Today’s activists use interactive maps to track everything from police brutality incidents to food deserts while building public support for their initiatives. These tools don’t just illustrate problems – they help communities envision and create solutions.
Disclosure: As an Amazon Associate, this site earns from qualifying purchases. Thank you!
Understanding the Power of Maps in Social Movements
Maps serve as powerful catalysts for social change by transforming complex data into compelling visual narratives that drive action and awareness.
P.S. check out Udemy’s GIS, Mapping & Remote Sensing courses on sale here…
Defining Cartographic Activism
Cartographic activism leverages maps to challenge existing power structures and advocate for social justice. This practice combines traditional mapping techniques with advocacy goals to highlight inequalities racial discrimination environmental issues and human rights violations. Activists use specialized mapping tools like GIS software participatory mapping and crowdsourced data collection to document community concerns and propose solutions. Notable examples include mapping food deserts in urban areas tracking police brutality incidents and visualizing climate change impacts on vulnerable populations.
Maps as Tools for Visual Communication
Maps translate complex social issues into clear visual stories that resonate with diverse audiences. Through strategic use of colors symbols and data layers activists create compelling narratives that reveal hidden patterns and relationships. Digital mapping platforms enable real-time updates interactive features and multimedia integration making information more accessible and engaging. Examples include heat maps showing income inequality interactive visualizations of gentrification patterns and temporal maps tracking the spread of social movements across regions.
Mapping Racial Justice and Civil Rights
Visualizing Segregation Patterns
Geographic Information Systems (GIS) reveal historical and current segregation through demographic data mapping. Modern mapping tools highlight redlining practices by overlaying 1930s HOLC maps with current census data showing persistent racial divisions. Digital platforms like Social Explorer and PolicyMap create interactive visualizations of racial distribution patterns across neighborhoods using metrics like dissimilarity indices and isolation scores. These tools help activists identify areas of concentrated poverty demographic shifts and systemic inequalities through color-coded choropleth maps.
Documenting Historic Civil Rights Routes
Interactive maps trace significant civil rights movement pathways including the Freedom Rides routes and Selma to Montgomery March. Digital mapping platforms like StoryMaps combine historical photos archival documents and geographical data to create immersive timelines of pivotal protests and demonstrations. Modern activists use these documented routes to plan commemorative events organize new marches and educate communities about local civil rights history. Route mapping tools integrate crowd-sourced photos videos and testimonials to preserve firsthand accounts of historic civil rights locations.
Transforming Environmental Advocacy Through Maps
Tracking Pollution and Climate Impact
Environmental advocates use digital mapping tools to document pollution sources emissions patterns and climate change impacts. GIS platforms like ArcGIS Earth and Google Earth Engine help track industrial emissions air quality data and temperature variations across regions. Organizations like the Environmental Defense Fund create interactive maps showing methane leaks water contamination sites and coastal flooding risks. These visualizations enable activists to identify environmental justice issues target cleanup efforts and push for policy changes by connecting pollution sources to affected communities.
Mapping Conservation Priorities
Conservation groups leverage mapping technology to identify crucial habitats protect endangered species and plan restoration projects. The World Wildlife Fund uses satellite imagery and GIS analysis to create detailed maps of biodiversity hotspots deforestation patterns and wildlife corridors. These tools help prioritize land acquisition efforts track ecosystem changes and guide resource allocation. Interactive maps also engage donors by showing the direct impact of conservation projects including before-and-after comparisons of restored habitats protected areas and species population recovery zones.
Amplifying Indigenous Rights with Traditional Maps
Traditional mapping practices serve as powerful tools for Indigenous communities to assert their rights and preserve their cultural heritage through visual documentation.
Preserving Cultural Territories
Indigenous communities use traditional mapping techniques to document sacred sites locations ceremonies hunting grounds and seasonal migration routes. These maps incorporate oral histories traditional place names and cultural landmarks that aren’t represented in conventional cartography. Organizations like Native Land Digital create interactive digital platforms that display Indigenous territories languages and treaties helping communities maintain connections to ancestral lands while educating the public about Indigenous presence and stewardship.
Defending Land Claims
Traditional maps strengthen Indigenous land claims by providing tangible evidence of historical occupation and continued use. Communities collaborate with cartographers to create detailed documentation of traditional territories using GPS technology combined with elder knowledge. These maps have successfully supported legal cases in courts worldwide including the landmark victories of the Inuit in Canada and Aboriginal peoples in Australia. Organizations like the Rainforest Foundation use participatory mapping to help Indigenous groups protect their lands from unauthorized development and resource extraction.
Using Digital Maps for Gender Equality
Highlighting Safety Concerns
Digital mapping tools enable women to identify unsafe areas through crowdsourced data collection platforms like SafetiPin and HarassMap. These platforms allow users to mark street harassment incidents traffic patterns unsafe lighting conditions and security concerns in real-time. Organizations use heat maps to visualize high-risk zones identify infrastructure gaps like poor street lighting and advocate for improved safety measures. Cities including Delhi Mexico City and Cairo have implemented safety audits based on these digital mapping initiatives.
Documenting Gender-Based Discrimination
Interactive maps track workplace discrimination patterns salary disparities and access to healthcare services across different regions. Organizations like UN Women utilize GIS technology to create data visualizations showing gender gaps in employment education and leadership positions. Digital mapping platforms document cases of workplace harassment maternity discrimination and hiring bias helping advocacy groups identify systemic issues. These tools combine demographic data with reported incidents to create compelling evidence for policy reform and corporate accountability.
Supporting Economic Justice Through Data Visualization
Mapping Income Inequality
Data visualization maps highlight economic disparities by tracking wealth distribution patterns across neighborhoods cities and regions. Tools like Social Explorer and PolicyMap create color-coded choropleth maps displaying median household income housing costs and poverty rates at multiple geographic scales. Interactive dashboards allow users to overlay economic indicators with demographic data revealing correlations between income levels educational attainment and race while time-series maps demonstrate how economic inequality evolves through gentrification urban development and policy changes.
Revealing Resource Distribution
GIS mapping tools expose disparities in access to essential resources and services across communities. Interactive maps plot the locations of banks healthcare facilities grocery stores and public transportation routes against demographic data highlighting service gaps in low-income areas. Organizations like the National Equity Atlas use these visualizations to identify food deserts banking deserts and healthcare access barriers. Digital platforms enable activists to document community needs create resource allocation proposals and advocate for equitable infrastructure development through data-driven storytelling.
Maps in Modern Grassroots Organizing
Digital mapping tools have revolutionized how grassroots movements organize mobilize and create change.
Coordinating Community Actions
Maps serve as vital coordination hubs for modern activism by enabling real-time organization of protests marches and community events. Organizers use platforms like Ushahidi and OpenStreetMap to mark gathering points designate march routes and highlight resource stations. Mobile mapping apps help volunteers navigate to specific locations track crowd movements and coordinate emergency response teams. These tools prove especially valuable during large-scale demonstrations where quick communication and spatial awareness are crucial for participant safety.
Building Digital Resistance Networks
Digital mapping platforms create virtual networks that connect activists across geographical boundaries through shared data and collaborative mapping projects. Tools like MapHub and Carto enable groups to build interactive resistance maps that document incidents track movement growth and identify areas needing support. Activists overlay demographic data with protest locations to reveal patterns of systemic inequality while secure mapping networks allow organizations to share sensitive information safely. These digital networks strengthen movement solidarity by visualizing collective actions and shared struggles across regions.
The Future of Cartographic Activism
Emerging Technologies and Tools
Virtual reality platforms now enable activists to create immersive 3D map experiences that highlight social issues with unprecedented impact. Artificial intelligence tools like computer vision analyze satellite imagery to detect environmental changes track urban development patterns in real-time. Blockchain technology ensures data integrity in crowdsourced mapping projects while augmented reality apps overlay social justice information onto physical locations. Advanced tools such as Mapbox GL JS Unity enable activists to build interactive storytelling experiences with 3D terrain visualization.
Evolving Role in Social Movements
Digital mapping platforms increasingly serve as central hubs for coordinating decentralized activism networks across global regions. Real-time collaborative mapping tools enable rapid response documentation of protests police interactions environmental violations while protecting participant privacy through encryption. Modern mapping applications help movements track resource distribution identify areas of need coordinate mutual aid networks. Organizations leverage predictive modeling to anticipate climate impacts environmental justice issues enabling proactive community organizing around emerging challenges.
Key Considerations for Map-Based Advocacy
Ethical Mapping Practices
When creating advocacy maps you must prioritize accuracy integrity & community consent. Protect vulnerable populations by obscuring sensitive location data such as refugee settlements or protest safe houses. Follow participatory mapping principles by engaging affected communities in the mapping process & respecting indigenous knowledge systems. Consider potential misuse of your maps & implement appropriate access controls. Always verify data sources maintain transparency about methodology & acknowledge cultural sensitivities in your map design.
Data Accessibility and Transparency
Make your advocacy maps accessible across different devices platforms & bandwidth capabilities. Use open data formats & provide clear documentation about data sources collection methods & update frequencies. Include downloadable datasets when appropriate while protecting sensitive information. Create multilingual legends & descriptions to reach diverse audiences. Implement accessibility features like screen reader compatibility & colorblind-friendly palettes. Maintain version control & provide contact information for data corrections or updates.
Get clear, full-page magnification with this 2-pack of 3X Fresnel lenses (7.5" x 10.5"), ideal for reading small print. Made from durable, optical-grade PVC, this set also includes 3 bonus bookmark magnifiers for on-the-go convenience.
Measuring the Impact of Movement Maps
Maps have evolved into powerful catalysts for social transformation by helping activists visualize issues document violations and mobilize communities. From tracking environmental injustices to highlighting racial inequalities these visual tools continue to shape how we understand and address societal challenges.
Today’s digital mapping technologies have revolutionized how social movements organize coordinate and share their stories. Whether it’s Indigenous communities protecting their lands women marking unsafe areas or environmental groups tracking pollution these tools provide tangible evidence that drives meaningful change.
As mapping technology continues to advance with AI VR and blockchain integration the future of cartographic activism looks promising. You’ll find these tools becoming even more essential in amplifying voices documenting injustices and fostering collaborative solutions for a more equitable world.


