11 Creative Map Projections Artists Use to Transform Geographic Space
Maps aren’t just tools for navigation – they’re canvases for creative expression that can transform our understanding of space and perspective. When you venture beyond traditional cartography into artistic map projections, you’ll discover endless possibilities for reimagining our world through unique visual interpretations.
Whether you’re a digital artist, traditional illustrator or experimental designer, creative map projections offer powerful ways to convey meaning through geographic distortion and artistic license. These innovative approaches to cartographic art let you bend space, emphasize certain regions and infuse maps with emotion and style that traditional projections simply can’t achieve.
Disclosure: As an Amazon Associate, this site earns from qualifying purchases. Thank you!
Understanding Map Projections in Art and Design
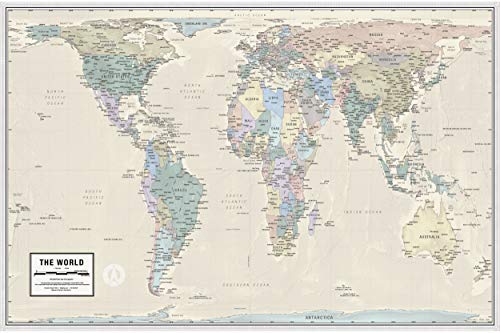
See the world accurately with this map showing countries in their true size and proportion. It's printed on high-quality, laminated paper and shipped rolled for optimal teaching and display.
The Intersection of Cartography and Creativity
Map projections serve as powerful tools for artists to challenge conventional spatial representations. Artists transform traditional cartographic elements into expressive visual statements by manipulating projection techniques scale distortions and coordinate systems. Contemporary digital artists use projection-based distortions to create surreal landscapes abstract geographical patterns and thought-provoking spatial narratives. Notable examples include Mark Nystrom’s wind maps and Paula Scher’s typographic geography which reimagine familiar territories through artistic projection choices.
P.S. check out Udemy’s GIS, Mapping & Remote Sensing courses on sale here…
Basic Principles of Map Projections
Map projections translate Earth’s three-dimensional surface onto a two-dimensional plane through mathematical transformations. The four fundamental properties affected by projections are shape area distance and direction. Each projection type preserves certain properties while distorting others creating unique visual effects. Key projection categories include:
- Cylindrical projections (Mercator Robinson) for rectangular layouts
- Azimuthal projections for polar or star maps
- Conic projections for regional emphasis
- Pseudocylindrical projections for thematic world maps
These principles provide artists with a framework to intentionally distort geography for creative impact while maintaining cartographic integrity.
Exploring the Dymaxion Map Projection
The Dymaxion map represents a groundbreaking approach to cartographic visualization that challenges traditional map projections.
Buckminster Fuller’s Revolutionary Design
Fuller’s Dymaxion projection displays Earth’s continents as a single island in an ocean of blue, arranged on an icosahedral net that unfolds into a flat surface. Created in 1943 this projection preserves relative sizes of continents while minimizing distortion. The design breaks free from conventional north-up orientation allowing the map to be rotated in any direction without privileging any continent or culture. Unlike traditional projections the Dymaxion map shows Earth’s landmasses with nearly proportional areas interconnected across its triangular segments.
Applications in Modern Art
Contemporary artists leverage the Dymaxion projection’s unique geometric properties to create compelling visual narratives. Digital artists manipulate the projection’s triangular segments in 3D modeling software to produce abstract geographical sculptures. Multimedia installations use animated Dymaxion maps to explore themes of global connectivity environmental change and social justice. Notable examples include Nicole Santucci’s “Dymaxion Woodocean World” and David McConville’s geodesic dome projections which reframe spatial relationships through Fuller’s revolutionary lens.
Transforming Gall-Peters for Artistic Expression
Social Commentary Through Distortion
The Gall-Peters projection serves as a powerful tool for artistic social commentary due to its equal-area properties that challenge traditional power dynamics. You can manipulate this projection to highlight global inequalities economic disparities or cultural biases. Artists like Vanessa Vobis use deliberate stretching of the projection’s vertical axis to emphasize North-South relationships creating thought-provoking installations about colonialism resource distribution and social justice. The projection’s mathematical framework allows for systematic distortion while maintaining relative area relationships.
Creating Visual Impact with Equal Area
You’ll find the Gall-Peters projection particularly effective for creating striking visual compositions that preserve area relationships. Transform the projection’s rectangular grid into dynamic shapes by adjusting the standard parallels or introducing curved elements while maintaining equal-area properties. Digital artists use software like QGIS and Adobe Illustrator to blend the projection’s mathematical precision with artistic elements such as gradient overlays texture mapping and selective color emphasis. This approach creates compelling visualizations for climate change data population distribution patterns and resource allocation maps.
| Artistic Technique | Visual Impact | Common Applications |
|---|---|---|
| Vertical Stretching | Emphasizes global power dynamics | Social justice art |
| Color Gradient Mapping | Shows data distribution | Climate change visualization |
| Texture Integration | Adds depth perception | Population density maps |
| Selective Distortion | Highlights specific regions | Economic inequality studies |
Crafting Art with the Waterman Butterfly Projection
The Waterman Butterfly projection unfolds our planet into a unique butterfly-like shape that offers artists an extraordinary canvas for creative expression.
Unfolding Earth’s Beauty
The Waterman Butterfly divides Earth’s surface into 12 distinct lobes that form symmetrical wings when flattened. Its interrupted design preserves continental shapes while minimizing area distortion making it ideal for artistic interpretations. You’ll find the projection particularly useful for creating world maps that highlight oceanic connections and continental relationships. The natural breaks between landmasses create compelling negative spaces perfect for incorporating decorative elements or data visualizations.
Symmetrical Design Opportunities
The projection’s butterfly-like symmetry opens up unique artistic possibilities for pattern creation and visual balance. You can enhance the natural rhythm by mirroring design elements across the central axis or creating gradient flows between adjacent lobes. Digital artists often exploit the projection’s geometric structure to develop intricate mandala-style compositions kaleidoscopic effects or tessellated patterns. The distinct segments also work well for thematic mapping where each lobe can represent different data sets or artistic themes.
Incorporating Polar Projections in Artwork
Polar projections offer unique artistic opportunities by placing either the North or South Pole at the center of your composition creating striking radial designs.
Arctic and Antarctic Perspectives
Transform your artwork using polar azimuthal projections that position Earth’s poles at the center of your canvas. Create stunning circular compositions by placing Antarctica or the Arctic as your focal point expanding outward to the equator. Map features like ice sheets glaciers and polar coastlines form natural radiating patterns while meridians create precise geometric divisions. Popular tools like ArcGIS and QGIS let you customize your pole-centered view adjusting the radius scale and rotation to achieve dramatic visual effects.
Circular Design Elements
Leverage the natural circular geometry of polar projections to develop mandala-like patterns and symmetrical designs. The convergence of longitude lines at the poles creates natural segments for dividing your artwork into balanced sections. Apply gradient effects that follow the concentric circles of latitude or use the polar grid as a framework for abstract patterns. Digital artists can enhance these circular elements using vector graphics software to add layers textures and dynamic color schemes that emphasize the radial composition.
Working with Interrupted Map Projections
Goode Homolosine in Art
The Goode Homolosine projection offers artists a unique canvas by splitting continents into organic segments that preserve area relationships. You’ll find its distinctive interruptions create natural breaks perfect for artistic interpretation particularly in data visualization and abstract mapping. Artists like Emma Willard have used this projection to create striking pieces that emphasize continental relationships while playing with negative space between landmasses. The projection’s lobed structure enables creative color schemes texture patterns and symbolic overlays.
Creating Fragmented World Views
Interrupted projections let you break free from traditional continuous map layouts to create compelling fragmented compositions. Transform continental pieces into floating islands arrange them in geometric patterns or stack them vertically to convey hierarchy. Digital tools like QGIS and Mapbox allow you to isolate individual segments customize their placement and apply unique styling to each fragment. Consider using these breaks to highlight global data patterns environmental changes or cultural connections through strategic positioning and visual treatment.
Experimenting with Retroazimuthal Projections
Retroazimuthal projections offer unique artistic opportunities by maintaining accurate directions to a central point while creating distinctive visual distortions across the map surface.
Direction-Based Artistic Concepts
Communicate without words in Concept, a game where you convey ideas using universal icons. Its easy-to-learn gameplay and vibrant design provide endless entertainment for all ages.
Transform retroazimuthal projections into radial artwork by emphasizing directional lines from your chosen center point. Create dynamic compositions using the Mecca projection’s natural flow lines to develop spiral patterns or starburst effects. Incorporate gradient overlays that follow the direction-preserving properties to highlight spatial relationships. Use tools like QGIS to experiment with the Craig projection’s characteristic curves turning them into abstract geometric patterns that maintain their mathematical foundation.
Cultural Storytelling Through Maps
Apply retroazimuthal projections to craft narrative-driven maps that connect cultural landmarks to a central location. Design pieces that visualize migration patterns stories or historical trade routes using the natural directional properties of these projections. Blend traditional symbolism with modern data visualization by mapping cultural connections to religious sites historical capitals or ancient gathering places. Transform geographical relationships into artistic expressions of cultural heritage using customized color schemes and symbolic elements.
Digital Tools for Artistic Map Manipulation
Software and Applications
- Adobe Illustrator & Photoshop offer vector-based map editing with layering capabilities & artistic filters
- QGIS provides free open-source mapping with custom projection support & style options
- Mapbox Studio enables interactive web-based map design with custom colors & patterns
- ArcGIS Pro delivers professional-grade cartographic tools with advanced symbolization options
- Blender transforms 2D maps into 3D artistic landscapes with texture mapping & rendering
- MAPublisher integrates geographic data with Adobe design tools for creative cartography
- Transform projections using coordinate reference system (CRS) tools in GIS software
- Apply raster warping to stretch & manipulate map imagery
- Create custom projections by modifying standard parameters
- Blend multiple projections using transparency & layer masks
- Generate unique cartographic effects through projection stacking
- Export vector layers to design software for artistic enhancement
- Utilize reprojection algorithms for experimental distortions
- Combine different projection types for hybrid artistic maps
Both sections focus on practical tools & methods while maintaining creative flexibility for artistic expression.
Blending Multiple Projections in One Piece
Combining different map projections in a single artwork creates unique visual narratives and emphasizes specific geographic relationships.
Layer Composition Methods
Create depth in your map artwork by stacking projections with complementary properties. Use equirectangular projections as base layers with polar projections as overlays to highlight both global patterns and polar details. Blend layers through opacity adjustments in Adobe Photoshop or QGIS using multiply blend modes for seamless transitions. Set different projections to distinct color schemes or textures to maintain visual clarity between layers while establishing hierarchy through strategic placement.
Creating Dynamic Perspectives
Transform static maps into dynamic compositions by varying projection centers and orientations. Position an azimuthal projection centered on your focal point with a Mercator overlay rotated 45 degrees to create visual tension. Experiment with projection transitions using digital mapping tools like MapBox GL JS to animate between views. Apply selective distortion by manipulating coordinate grids in specific regions while maintaining recognizable landforms in others. Incorporate oblique perspectives through tilted projections to add dramatic depth to your artistic maps.
Conclusion: The Future of Artistic Map Projections
Map projections have evolved far beyond their cartographic origins to become powerful tools for artistic expression. You’ll find endless creative possibilities by combining different projection techniques with modern digital tools and artistic vision.
The fusion of traditional cartography with contemporary art opens new avenues for storytelling visualization and social commentary. From the revolutionary Dymaxion to the symmetrical Waterman Butterfly each projection offers unique opportunities to transform geographic data into compelling visual narratives.
As digital tools become more sophisticated you’ll discover even more ways to push the boundaries of artistic map creation. Whether you’re a digital artist traditional illustrator or experimental designer these creative approaches to cartography will help you craft distinctive and meaningful artistic expressions.
