11 Innovative Cartographic Techniques That Transform Environmental Data Mapping
Mapping our environment has evolved far beyond simple paper charts and pins on a wall. Today’s environmental cartography combines cutting-edge technology with creative visualization techniques to help you understand complex ecological data in ways never before possible.
Modern mapping tools now let you explore everything from climate patterns and wildlife migrations to pollution levels and deforestation rates through interactive 3D models dynamic heat maps and real-time satellite imagery. Whether you’re a researcher activist or concerned citizen these innovative cartographic techniques make it easier than ever to spot environmental trends make informed decisions and communicate critical data to others who can help drive positive change.
Disclosure: As an Amazon Associate, this site earns from qualifying purchases. Thank you!
Understanding Modern Environmental Cartography
Evolution of Environmental Mapping
Environmental mapping has transformed from static paper maps into dynamic digital representations. Since the 1960s cartographers have integrated satellite imagery remote sensing data and GIS technology to create more accurate environmental visualizations. The field evolved through key developments like LANDSAT imagery in 1972 GPS integration in the 1990s and cloud-based mapping platforms in the 2000s. Today’s environmental maps combine multiple data layers including terrain modeling atmospheric data and ecological indicators to provide comprehensive environmental analysis tools.
Current Trends in Digital Mapping
Digital environmental mapping now leverages machine learning algorithms real-time data streams and interactive 3D visualization. Leading trends include participatory GIS platforms that enable citizen scientists to contribute environmental data web-based story maps that communicate environmental changes and automated feature extraction from satellite imagery. Tools like ArcGIS Online Google Earth Engine and QGIS now offer cloud computing capabilities for processing massive environmental datasets. Advanced techniques such as LiDAR integration deep learning classification and augmented reality visualization are reshaping how we understand and present environmental data.
Leveraging 3D Visualization Techniques
Interactive Terrain Modeling
Transform 2D environmental data into dynamic 3D landscapes using advanced terrain modeling tools. ArcGIS Pro’s interactive terrain analysis lets you manipulate elevation data LiDAR point clouds and satellite imagery to create detailed topographic models. You’ll enhance your environmental mapping by incorporating real-time shadow analysis slope calculations and viewshed modeling. These features help identify erosion patterns watershed boundaries and potential impact zones for environmental projects.
Virtual Reality Environmental Mapping
Virtual reality brings unprecedented depth to environmental data visualization by creating immersive 3D experiences. Using platforms like Unity3D with GIS plugins you can build walkthrough environments that display complex ecological data. Your VR maps can showcase forest density measurements air quality readings and wildlife migration patterns in an intuitive spatial context. This technology enables stakeholders to experience environmental changes firsthand through virtual site visits and interactive data exploration.
Learn to build robust games in Unity 2021 using proven software design patterns and C# best practices. This book helps you create maintainable and scalable game architectures.
Implementing Real-Time Data Integration
Real-time data integration transforms traditional environmental mapping into dynamic decision-support systems.
Live Satellite Feed Integration
Connect your mapping platform to real-time satellite feeds using APIs from providers like Planet Labs or Sentinel Hub. Configure automated data pipelines to process incoming imagery using cloud computing services like AWS or Google Earth Engine. Stream live satellite data through WebSocket protocols to display natural disasters wildfires floods or oil spills as they occur. Key platforms supporting this integration include:
This part (359-6124) is made in the USA. The package measures 8" x 8" x 2" and weighs 0.1 pounds.
- FIRMS for active fire monitoring
- Sentinel Hub for vegetation analysis
- Planet Monitoring for land use changes
- NOAA GOES for storm tracking
IoT Sensor Network Mapping
Deploy environmental IoT sensors to collect ground-level data and visualize it through dynamic mapping interfaces. Use MQTT protocols to stream sensor data from air quality monitors weather stations or water quality sensors directly to your map. Popular IoT mapping solutions include:
- Grafana for real-time dashboards
- ThingsBoard for sensor visualization
- MapBox for IoT data streams
- ArcGIS GeoEvent Server for enterprise solutions
Connect multiple sensor networks using standardized protocols like LoRaWAN to create comprehensive environmental monitoring systems that update automatically.
Exploring Advanced Geographic Information Systems
Modern GIS platforms leverage cutting-edge technologies to transform environmental data into actionable insights.
Machine Learning Applications in GIS
Machine learning algorithms enhance GIS analysis by processing vast environmental datasets with unprecedented accuracy. Tools like TensorFlow integrate with ArcGIS Pro to classify land use patterns from satellite imagery automatically. Popular applications include species habitat prediction using MaxEnt predictive modeling forest health assessment through random forest algorithms and coastal erosion forecasting via neural networks. These ML-powered solutions process terabytes of spatial data to identify complex environmental patterns in minutes.
Automated Pattern Recognition
Advanced pattern recognition systems revolutionize environmental monitoring through automated feature detection. ArcGIS Image Analyst and ENVI’s Feature Extraction tools use spectral signatures to identify vegetation types invasive species and land use changes. Deep learning frameworks like YOLOv4 detect wildlife in aerial imagery while eCognition Developer segments complex landscapes into distinct ecological zones. These systems achieve 90% accuracy in identifying environmental features across diverse terrains.
Utilizing Remote Sensing Technologies
LiDAR Mapping Solutions
LiDAR technology revolutionizes environmental mapping through precise 3D point cloud generation. Modern LiDAR systems capture up to 1 million points per second with accuracy levels of 2-3 centimeters using both terrestrial and airborne platforms. You’ll find LiDAR particularly effective for mapping forest canopy structure wetland topography and urban heat islands. Key software solutions include TerraScan for vegetation analysis CloudCompare for point cloud processing and LAStools for data filtering. These tools enable the creation of detailed Digital Terrain Models (DTMs) and Digital Surface Models (DSMs) essential for environmental assessment.
Explore the accuracy of Apple LiDAR for 3D surveying in field sciences. This Japanese edition focuses on physiognomies and volumes of 3D targets.
Experience the romantic tragedy "Joguines de fira" by M. Gras Vila, a volume from 1916. This edition is beautifully bound in leather.
Drone-Based Data Collection
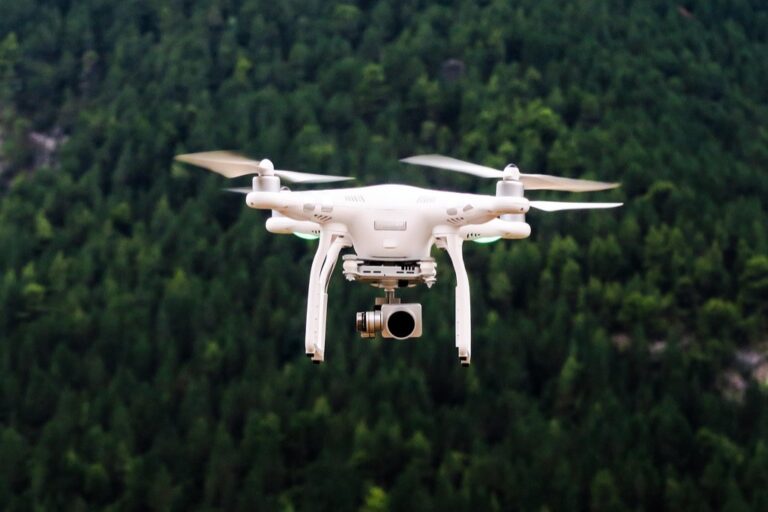
Drone mapping transforms environmental data collection through rapid high-resolution surveys. Modern drones equipped with multispectral sensors capture imagery at 2-5 cm resolution covering up to 1000 acres per flight. You’ll achieve optimal results using platforms like DJI Phantom 4 RTK for precision mapping or the senseFly eBee X for larger surveys. Essential processing software includes Pix4Dmapper for orthomosaic generation PhotoScan for 3D modeling and DroneDeploy for real-time mapping. These tools enable rapid assessment of vegetation health erosion patterns and habitat changes while maintaining centimeter-level accuracy.
Quickly scan and preserve your photos with the Epson FastFoto scanner. Scan thousands of photos rapidly at up to 1 photo per second and easily restore old photos with auto enhancement features.
Incorporating Big Data Analytics
Big data analytics transforms environmental cartography by processing massive datasets to reveal hidden patterns and correlations in environmental phenomena.
Cloud-Based Processing Methods
Cloud platforms like Google Earth Engine and Microsoft Planetary Computer enable processing of petabyte-scale geospatial data. These platforms offer distributed computing resources to analyze satellite imagery collections dating back 40+ years. Amazon Web Services (AWS) provides specialized tools like SageMaker for running machine learning models on environmental datasets while Azure’s Planetary Computer supports parallel processing of global-scale earth observation data with preconfigured environmental science workflows.
Predictive Environmental Modeling
Modern predictive modeling integrates multiple data streams to forecast environmental changes with unprecedented accuracy. Platforms like TerrSet’s Land Change Modeler use neural networks to predict land use changes with 85%+ accuracy. Environmental modeling software such as CLIMEX and MaxEnt combine climate data biometric parameters and species occurrence records to project future habitat distributions. These tools enable scenario planning by simulating different climate conditions pollution levels and development patterns.
Developing Interactive Web-Based Maps
Modern interactive web mapping transforms static environmental data into dynamic user-driven experiences using tools like Mapbox GL JS Leaflet and OpenLayers.
User Experience Design
Design intuitive map interfaces with clear visual hierarchies layered navigation systems and responsive controls. Implement hover states tooltips and pop-ups to display detailed environmental data when users interact with map features. Include essential UI elements like:
- Collapsible layer controls for toggling environmental datasets
- Dynamic legend that updates based on visible data
- Search functionality with autocomplete for locations
- Clear zoom controls and scale indicators
- Custom basemap styles optimized for environmental data display
- Interactive timeline sliders for temporal data exploration
- Progressive loading of map tiles to reduce initial load times
- Touch-optimized controls sized for finger interaction
- Simplified layer controls through swipe gestures
- Compressed data formats for faster mobile rendering
- Location-based features using device GPS
- Offline map caching for field use
- Adaptive symbology that scales with screen size
Creating Dynamic Time Series Visualizations
Time series visualizations transform static environmental data into compelling narratives that reveal patterns and changes over specific periods.
Temporal Data Animation
Create frame-based animations using QGIS TimeManager or ArcGIS Pro’s Time Slider to showcase environmental changes. Set keyframes at monthly or yearly intervals to display shifts in vegetation cover wildfire spread or urban growth. Import temporal datasets from sources like MODIS or Landsat maintaining a consistent 30-60 frame rate for smooth transitions. Configure time stamps date ranges and playback speeds using tools like Temporal Controller in ArcGIS or the Animation Timeline in QGIS.
Climate Change Progression Mapping
Build dynamic climate visualizations using tools like Climate Reanalyzer or NOAA’s Climate.gov data portals. Map temperature anomalies precipitation patterns and sea level changes across multiple decades. Process NetCDF files through specialized tools like Panoply or NCL focusing on 30-year climate normals. Implement color ramps that align with IPCC standards ranging from cool blues (-2°C) to warm reds (+2°C) for temperature variations. Layer historical weather station data with projected climate models to create comprehensive change analyses.
| Time Series Tools | Frame Rate | Data Format |
|---|---|---|
| QGIS TimeManager | 30 fps | Vector/Raster |
| ArcGIS Time Slider | 60 fps | Multiple |
| Climate Reanalyzer | 24 fps | NetCDF |
| Panoply | 30 fps | NetCDF/HDF |
Integrating Social and Environmental Data
Community Impact Visualization
Interactive mapping tools now merge demographic data with environmental indicators to reveal how ecological changes affect different communities. Tools like Social Explorer and PolicyMap integrate census data with environmental metrics using APIs that update automatically. Key visualization techniques include choropleth maps showing vulnerability indices dot density maps displaying population exposure to environmental hazards and proportional symbols representing community resource access. These tools help identify environmental justice concerns through clear visual hierarchies.
Socio-Environmental Pattern Analysis
Advanced spatial analysis techniques combine social vulnerability indicators with environmental risk data to identify communities most affected by ecological changes. Tools like GeoDa and R’s spdep package calculate spatial autocorrelation metrics including Moran’s I and LISA statistics to detect clustering patterns. Methods like weighted overlay analysis integrate variables such as income levels flood risk and air quality indices. Popular platforms like QGIS’s MMQGIS plugin automate the creation of bivariate choropleth maps showing relationships between social and environmental factors.
Transforming the Future of Environmental Mapping
Modern cartographic techniques have revolutionized how you visualize and understand environmental data. From LiDAR mapping and drone surveys to machine learning algorithms and real-time IoT sensor networks these innovations offer unprecedented insights into our changing environment.
The fusion of big data analytics cloud computing and interactive visualization tools puts powerful environmental monitoring capabilities at your fingertips. You can now track ecological changes develop predictive models and communicate complex environmental data more effectively than ever before.
The future of environmental mapping lies in these innovative technologies working together to create comprehensive monitoring systems. By embracing these advanced cartographic tools you’ll be better equipped to address environmental challenges make informed decisions and drive positive ecological change.


