12 Data Visualization Methods in Cartography That Reveal Hidden Patterns
Transforming complex geographical data into clear visual stories has never been more crucial in today’s data-driven world. Modern cartography blends traditional mapping techniques with cutting-edge data visualization methods to help you understand and communicate spatial information effectively.
Whether you’re creating interactive web maps dynamic thematic displays or analyzing geographical patterns you’ll find that mastering data visualization in cartography opens up powerful ways to share insights and make informed decisions about our world. From choropleth maps to 3D terrain modeling the right visualization method can transform raw data into compelling visual narratives that anyone can understand.
Disclosure: As an Amazon Associate, this site earns from qualifying purchases. Thank you!
Understanding the Foundations of Cartographic Data Visualization
Effective cartographic visualization requires mastering fundamental design principles and understanding how visual elements communicate spatial information.
Basic Principles of Map Design
Map design relies on four essential principles: hierarchy balance clarity and emphasis. Visual hierarchy guides viewers through different levels of information using size color and placement. Balance creates stability by distributing map elements like legends scale bars and insets evenly across the layout. Clarity ensures readability through appropriate font choices symbol selection and white space management. Emphasis highlights key geographic features or data patterns through contrast isolation or color manipulation.
The Role of Visual Variables
Visual variables serve as building blocks for encoding geographic data effectively on maps. These include size (showing quantity) color (representing categories or values) shape (distinguishing features) orientation (displaying direction) texture (indicating patterns) and value (showing intensity). When designing maps choose visual variables that match your data type: use sequential color schemes for continuous data ordinal schemes for ranked data and qualitative schemes for categorical information. Strategic combination of these variables creates clear visual hierarchies that help readers understand complex spatial relationships.
Exploring Traditional Thematic Mapping Techniques
Traditional thematic mapping techniques form the foundation of modern cartographic visualization using established methods to represent spatial data patterns.
Choropleth Maps
Choropleth maps use color gradients to display data variations across geographic areas. You’ll find these maps effective for showing population density census data or election results. The key to creating impactful choropleth maps lies in selecting appropriate color schemes and classification methods. Natural breaks Jenks optimization or quantile classifications help determine meaningful data groupings while sequential or diverging color schemes enhance data interpretation.
Proportional Symbol Maps
Proportional symbol maps display quantitative data through differently sized symbols typically circles or squares. You’ll see these maps used for showing city populations earthquake magnitudes or economic indicators. The symbol size directly correlates with the data value making it easy to compare quantities across locations. Scale considerations are crucial as overlapping symbols can create readability issues in dense areas.
Dot Density Maps
Dot density maps represent quantities through collections of uniform dots where each dot equals a specific value. You’ll encounter these maps when visualizing population distribution agricultural production or disease occurrence. The dot placement algorithm and dot value selection significantly impact the map’s effectiveness. Strategic dot sizing ensures clear visualization while maintaining statistical accuracy in representing the underlying data.
Isopleth and Isarithmic Maps
Isopleth and isarithmic maps display continuous phenomena through contour lines connecting points of equal value. You’ll use these maps for showing elevation temperature precipitation or other gradually changing data. The interpolation method whether it’s kriging or inverse distance weighting determines the accuracy of your contours. Appropriate contour intervals help reveal spatial patterns while maintaining map clarity.
Mastering 3D Terrain Visualization Methods
Transform your flat maps into dynamic 3D visualizations with advanced terrain modeling techniques that bring topographic data to life.
Digital Elevation Models (DEM)
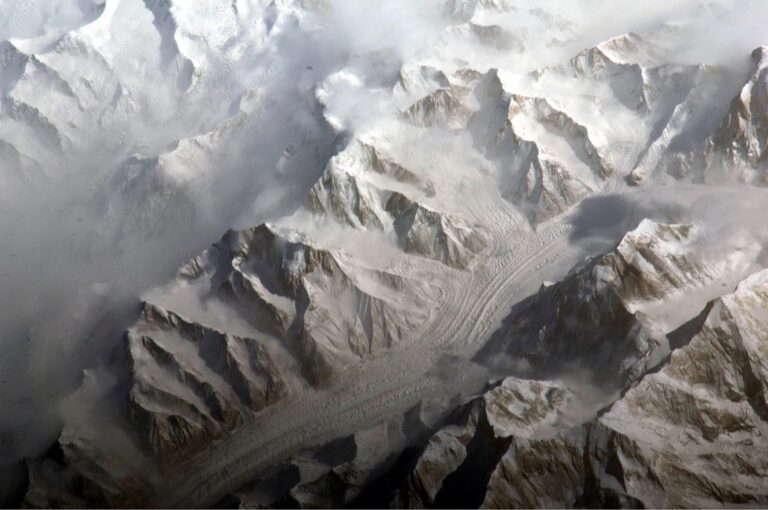
DEMs serve as the foundation for 3D terrain visualization by representing ground surface elevation through a grid of height values. Use high-resolution DEM data from sources like USGS 3DEP or SRTM to create accurate terrain models. Modern GIS software like ArcGIS Pro QGIS lets you process raw DEM data through:
Master ArcGIS Pro 3.2 with this comprehensive guide. Learn essential GIS workflows and data management techniques for effective spatial analysis.
- Void filling to eliminate data gaps
- Resampling for optimal resolution
- Edge matching between adjacent tiles
- Vertical accuracy assessment
Hillshading and Relief Mapping
Create realistic terrain representations by applying hillshading algorithms to your DEM data. Adjust sun angle azimuth settings between 315-360 degrees and altitude between 30-45 degrees for optimal shadow effects. Enhance terrain visualization through:
- Multi-directional hillshading
- Vertical exaggeration factors
- Blending with elevation colors
- Customized shadow intensities
- Controlled vertical exaggeration
- Custom camera positions
- Layer draping techniques
- Interactive viewing angles
- Atmospheric effects
Implementing Interactive Mapping Technologies
Modern interactive mapping requires a strategic blend of web technologies visualization tools and user-centric design principles to create engaging digital cartographic experiences.
Web-Based Mapping Platforms
Leading web mapping platforms like Mapbox Leaflet and OpenLayers provide robust frameworks for creating interactive maps. These platforms offer essential features including tile serving vector mapping and customizable basemaps. Mapbox excels in style customization while Leaflet prioritizes lightweight performance. OpenLayers delivers advanced GIS functionality through WebGL rendering. Each platform supports various data formats including GeoJSON TopoJSON and vector tiles enabling seamless integration with existing spatial databases.
Real-Time Data Integration
Real-time mapping systems leverage WebSocket connections and REST APIs to stream live geographic data. Modern platforms support dynamic data updates through GeoServer PostGIS or MongoDB spatial databases. Implementation requires efficient data caching smart filtering and automated symbology updates. Leading solutions like MapboxGL JS handle real-time updates at 60 frames per second while maintaining smooth performance across desktop and mobile devices.
Master spatial data management with PostGIS in Action, Third Edition. Learn to build location-aware applications using this powerful database extender's advanced geoprocessing and analysis capabilities.
User Interface Design
Effective mapping interfaces incorporate responsive layouts intuitive zoom controls and clear feature selection tools. Essential UI elements include a scalable legend dynamic popup windows and customizable filter controls. Design patterns should follow WCAG accessibility guidelines with high-contrast colors keyboard navigation and screen reader support. Touch-friendly controls with appropriate hit areas ensure usability across devices while maintaining a clean uncluttered interface that emphasizes the map content.
Leveraging Advanced Data Visualization Tools
Modern cartography relies heavily on sophisticated digital tools that transform raw geographic data into meaningful visual narratives.
Geographic Information Systems (GIS)
Advanced GIS platforms like ArcGIS Pro and QGIS provide comprehensive toolsets for spatial data analysis and visualization. These systems excel at processing vector and raster data while offering specialized cartographic tools for symbol management color schemes and label placement. You’ll find built-in capabilities for spatial analysis network modeling and advanced symbology that support both 2D and 3D mapping applications. GIS platforms also enable seamless integration with databases web services and real-time data streams.
Remote Sensing Applications
Remote sensing software like ERDAS IMAGINE and ENVI transforms satellite and aerial imagery into actionable geographic information. These tools offer sophisticated image processing capabilities including atmospheric correction spectral analysis and feature extraction. You’ll access specialized algorithms for land cover classification change detection and terrain analysis. Advanced visualization features help process multispectral imagery thermal data and LiDAR point clouds while maintaining spatial accuracy.
Data Processing Software
Specialized data processing tools like FME MapInfo Pro and Global Mapper streamline the handling of complex spatial datasets. These platforms excel at data conversion coordinate system transformations and automated workflow creation. You’ll find robust capabilities for batch processing quality control and data validation. The software supports multiple data formats enables custom scripting and provides efficient tools for managing large geographic datasets while maintaining data integrity.
Applying Color Theory in Cartographic Design
Color selection plays a crucial role in effective map design serving both aesthetic and functional purposes in data visualization.
Color Schemes and Palettes
Select color schemes based on your data type and visualization goals. Use sequential palettes (light to dark variations) for showing numerical progression like population density. Apply diverging palettes (contrasting colors) to highlight deviations from a central value such as temperature changes. Choose qualitative palettes (distinct hues) for categorical data like land use types. Industry-standard tools like ColorBrewer 2.0 provide scientifically-tested cartographic color schemes that ensure clear data communication.
Visual Hierarchy
Establish clear visual hierarchy through strategic color use to guide map readers’ attention. Apply bold vibrant colors to emphasize primary features and muted tones for background elements. Create depth by using high-contrast colors for foreground elements and lower-contrast hues for supporting information. Follow the 60-30-10 rule: 60% dominant color 30% secondary color and 10% accent color to maintain balance while highlighting key geographic features.
Color Accessibility
Design maps considering colorblind viewers who represent about 8% of males and 0.5% of females globally. Avoid problematic color combinations like red-green which are commonly confused. Use tools like Colorblind Web Page Filter to test your maps for accessibility. Incorporate patterns textures or labels to supplement color-coded information. Ensure sufficient contrast between features meeting WCAG 2.1 guidelines with a minimum contrast ratio of 4.5:1 for normal text.
Experience comfortable viewing with reduced blue light emissions and accurate colors thanks to Dell's ComfortView Plus. Enjoy smooth visuals with a 100Hz refresh rate and versatile connectivity with dual HDMI ports.
Integrating Statistical Data Visualization
Statistical visualization transforms complex spatial data into meaningful insights through targeted techniques and analytical methods.
Charts and Graphs on Maps
Embed interactive charts directly onto your maps using modern visualization libraries like D3.js and Highcharts. Create pop-up graphs that display temporal trends location-specific data or incorporate side-panel dashboards showing demographic statistics. Layer pie charts proportional circles or bar graphs onto specific geographic points to represent multivariate data such as population demographics retail sales or environmental measurements. Use synchronized views where selecting map features updates linked statistical displays for deeper analysis.
Master data visualization with Learning Highcharts! Create interactive and dynamic charts for your web applications using this comprehensive guide, packed with practical examples and clear explanations.
Data Classification Methods
Apply statistical classification methods to organize numerical data into meaningful categories for thematic mapping. Choose from natural breaks (Jenks) for optimal class divisions equal interval for uniform ranges quantiles for equal-sized groups or standard deviation for statistical distribution. Match your classification method to your data type: use natural breaks for clustered data equal interval for evenly distributed values or quantiles for ranked data. Implement dynamic classification that updates as users zoom or filter.
Statistical Surface Mapping
Create continuous statistical surfaces using interpolation methods like Inverse Distance Weighting (IDW) or Kriging. Generate density maps from point data using kernel density estimation to reveal spatial patterns in crime rates population distribution or environmental measurements. Apply trend surface analysis to identify regional patterns and directional trends in your data. Combine multiple statistical surfaces using map algebra to perform complex spatial analysis and reveal relationships between different variables.
Optimizing Digital Cartography Workflows
Streamlining digital cartography processes ensures consistent map production while maintaining high-quality standards.
Automation Techniques
Implement Python scripting with ArcPy or PyQGIS to automate repetitive mapping tasks such as symbology updates feature extraction or batch processing. Use Model Builder in ArcGIS Pro or the Graphical Modeler in QGIS to create reusable workflows for data preprocessing map generation and output formatting. Leverage FME Workbench for complex data transformation pipelines that can handle multiple formats coordinate systems and styling requirements automatically.
Quality Control Methods
Establish systematic quality checks using automated validation tools like QGIS Topology Checker or ArcGIS Data Reviewer. Create standardized checklists for map elements including projection accuracy scale bar placement legend formatting and label positioning. Deploy tools like MapTiler or TileMill to verify tile rendering across zoom levels. Use GeoDa for spatial statistical analysis to identify outliers and data anomalies before final map production.
Master interactive maps with the Mapbox Cookbook! Learn practical recipes and expert techniques to build stunning, custom map visualizations for web and mobile applications.
Version Control Systems
Integrate Git-based version control with platforms like GeoGig or GitHub to track changes in spatial data and map documents. Store map templates symbology files and scripts in repositories with clear versioning protocols. Use branching strategies for parallel development of different map versions while maintaining a stable production branch. Implement continuous integration tools like Jenkins to automate testing of mapping workflows when changes are committed.
Embracing Modern Mapping Innovations
Today’s cartographic landscape embraces cutting-edge technologies that transform how we create and interact with spatial information.
Augmented Reality Maps
AR technology revolutionizes traditional cartography by overlaying digital geographic information onto the real world. Mobile apps like Google Live View and ARCGIS QuickCapture enable users to view real-time mapping data through their smartphone cameras. These solutions integrate GPS location services street-level imagery and 3D models to provide contextual wayfinding. AR maps excel in urban navigation tourism and field data collection offering features like point-of-interest recognition landmark identification and dynamic routing.
Virtual Reality Applications
VR transforms cartographic visualization by creating immersive 3D geographic environments. Platforms like ArcGIS CityEngine and Unity enable the development of virtual landscapes where users can explore spatial data from any angle. These applications support urban planning disaster response simulation and environmental analysis. Users can manipulate terrain models analyze spatial relationships and experience geographic data through intuitive VR interfaces using tools like Oculus Quest or HTC Vive.
Mobile Mapping Solutions
Modern mobile mapping apps leverage cloud computing and real-time data integration for dynamic cartographic experiences. Applications like Mapbox Mobile and Carto deliver customizable mapping solutions with offline functionality location-based services and crowd-sourced data integration. These platforms support field data collection asset tracking and location intelligence through APIs that connect to enterprise GIS systems. Features include custom basemap styling geofencing capabilities and collaborative mapping tools.
Future Trends in Cartographic Visualization
The ever-evolving landscape of cartographic visualization continues to shape how you’ll interact with geographic data. Modern technologies like AR VR and cloud computing are revolutionizing map creation and consumption while making spatial information more accessible than ever.
As you explore these cutting-edge tools and techniques your ability to create compelling visual stories from complex spatial data will only grow stronger. The fusion of traditional cartographic principles with innovative digital solutions opens new possibilities for interactive engaging and insightful maps.
The future of cartographic visualization lies in adaptable user-centric designs that seamlessly blend data analysis with immersive experiences. By embracing these emerging trends you’ll be well-equipped to meet the growing demands for dynamic and accessible geographic visualization in our increasingly data-driven world.


