9 3D Map Visualization Techniques That Transform Spatial Analysis
Creating stunning 3D map visualizations doesn’t have to feel like rocket science. Whether you’re a GIS professional, data scientist, or curious explorer, modern tools and techniques make it easier than ever to transform flat geographical data into immersive three-dimensional experiences.
You’ll discover how combining elevation data, texture mapping, and interactive elements can breathe new life into your spatial analyses. From urban planning to environmental studies, these visualization methods help communicate complex geographical information in ways that captivate your audience while delivering powerful insights.
Disclosure: As an Amazon Associate, this site earns from qualifying purchases. Thank you!
Understanding the Basics of 3D Map Visualization
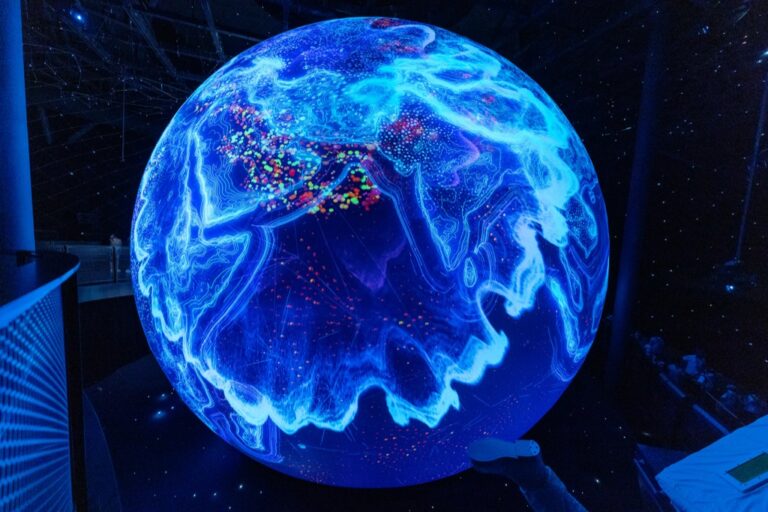
Three-dimensional map visualization transforms flat geographical data into dynamic spatial representations using elevation height vectors texture mapping and interactive elements.
Key Principles of 3D Mapping
- Elevation Data Integration: Convert height information into vertical dimensions using DEM (Digital Elevation Model) data
- Spatial Reference Systems: Implement coordinate systems like WGS84 or UTM for accurate geographic positioning
- Layer Management: Stack multiple data layers including terrain basemaps thematic overlays and vector features
- Visual Hierarchy: Apply color schemes symbology and scale variations to highlight important map elements
- Interactive Navigation: Enable pan zoom rotate and tilt functions for comprehensive spatial exploration
Essential Tools and Software Platforms
-
Desktop GIS Applications
- QGIS: Free open-source platform with 3D visualization plugins
- ArcGIS Pro: Professional suite with advanced 3D mapping capabilities
- Global Mapper: Specialized in terrain modeling and analysis
-
Web-Based Solutions
- Mapbox GL JS: JavaScript library for interactive 3D maps
- Cesium: Open platform for geospatial 3D visualization
- Google Earth Engine: Cloud-based platform for satellite imagery analysis
- LAStools: LiDAR data processing and conversion
- BlenderGIS: 3D modeling with geographic data integration
Choosing the Right Data Sources for 3D Mapping
Selecting accurate and reliable data sources is crucial for creating detailed 3D map visualizations. Here’s a breakdown of essential data types and their applications.
Geographic Information System (GIS) Data
GIS data forms the foundation of your 3D mapping projects by providing vector layers like roads buildings and land use boundaries. Access comprehensive datasets through national mapping agencies like the USGS or OpenStreetMap for baseline geographical features. Commercial providers such as Esri and HERE offer specialized datasets with attributes for advanced analysis. Choose data sources that match your project’s scale resolution requirements and update frequency needs.
Digital Elevation Models (DEM)
DEMs provide the height information essential for creating realistic 3D terrain representations. Source high-resolution DEMs from NASA’s SRTM dataset which offers global coverage at 30-meter resolution or USGS 3DEP for US territories at up to 1-meter resolution. Consider LiDAR-derived DEMs for urban projects requiring building height accuracy. Check vertical accuracy ratings and data collection dates to ensure quality standards match your visualization goals.
Satellite Imagery and Aerial Photography
High-resolution imagery adds realistic textures and visual context to your 3D maps. Access current satellite imagery through providers like Maxar DigitalGlobe or Planet Labs offering sub-meter resolution. For detailed urban mapping use orthophotos from state agencies or commercial aerial surveys. Compare image collection dates temporal coverage and atmospheric conditions to select imagery that best represents your area of interest.
Explore the intersection of mapping, technology, and politics. This book analyzes how mapping practices shape our understanding of power and influence in the digital age.
Exploring Different 3D Visualization Techniques
Terrain Mapping and Elevation Profiles
Transform topographic data into dynamic 3D terrain models using Digital Elevation Models (DEMs). Start by importing USGS or SRTM elevation data into your GIS software then apply vertical exaggeration factors between 1.5x and 3x for optimal visualization. Create realistic terrain by adding hillshade effects with 315° azimuth and 45° altitude angles while incorporating contour lines at appropriate intervals. Enhance surface detail by overlaying high-resolution satellite imagery as a texture map using transparency settings between 40-60%.
Master ArcGIS Pro 3.2 with this comprehensive guide. Learn essential GIS workflows and data management techniques for effective spatial analysis.
Building Footprints and Urban Landscapes
Generate detailed 3D cityscapes by extruding building footprints based on height attributes from municipal databases or OpenStreetMap data. Set building heights using actual measurements or estimated floor counts multiplied by standard floor heights (3-4 meters). Apply custom textures to building facades using UV mapping techniques in tools like ArcGIS CityEngine or QGIS with the qgis2threejs plugin. Include street furniture shadow casting and ambient occlusion for enhanced realism.
Heat Maps and Population Density
Create dynamic population density visualizations using kernel density estimation with a search radius of 500-1000 meters. Apply a graduated color scheme ranging from cool blues (low density) to warm reds (high density) with 5-7 classification breaks. Layer these heat maps over your 3D terrain using transparency settings of 70-80% to maintain terrain visibility. Add interactive tooltips displaying exact population counts per square kilometer for precise analysis.
Implementing Interactive Features in 3D Maps
Dynamic Camera Controls
Implement intuitive camera navigation using libraries like Three.js or Mapbox GL JS to enhance user exploration. Set up mouse-driven controls for pan zoom rotate and tilt operations with smooth transitions and adjustable sensitivity. Add keyboard shortcuts for quick viewpoint changes such as:
- WASD keys for lateral movement
- Q/E for altitude adjustment
- Right-click drag for orbit
- Mouse wheel for zoom level
Configure boundary limits to prevent users from navigating beyond meaningful viewing angles or distances.
Layer Toggle Functions
Create interactive layer management using checkbox controls and opacity sliders for different map elements. Structure your layers into logical groups like:
- Base terrain and elevation data
- Infrastructure networks (roads utilities)
- Building footprints and 3D models
- Thematic overlays (demographics weather)
Implement layer visibility states using WebGL render passes or scene graph manipulation. Add smooth fade transitions between layer states for seamless visualization changes.
Real-Time Data Updates
Connect your 3D map to live data streams using WebSocket connections or REST API polling. Configure automatic updates for:
- Traffic flow visualization
- Weather radar overlays
- Sensor network readings
- Vehicle tracking systems
Set up efficient data caching and buffer management to handle frequent updates without performance degradation. Include timestamp displays and update frequency controls to help users track data freshness.
Adding Visual Elements for Enhanced Engagement
Transform your 3D maps from basic visualizations into captivating experiences by incorporating strategic visual elements that improve both aesthetics and functionality.
Custom Textures and Materials
Apply realistic textures to enhance your 3D map features using high-resolution imagery and material mapping. Import satellite imagery textures for terrain surfaces with tools like Mapbox or ArcGIS Pro. Create custom building materials by using photo-realistic textures for facades windows and roofs. Implement procedural texturing to generate dynamic patterns for large-scale features like forests water bodies or agricultural lands. Optimize texture resolution and compression to maintain performance while preserving visual quality.
Lighting and Shadow Effects
Implement dynamic lighting systems to create depth and atmosphere in your 3D visualizations. Set up ambient light for consistent base illumination and directional lights to simulate sun positions. Add point lights to highlight specific map features or areas of interest. Configure realistic shadow mapping to enhance depth perception and spatial relationships. Use ambient occlusion to create subtle shadowing in corners and crevices. Adjust light intensity and color temperature to match different times of day or atmospheric conditions.
Color Schemes and Symbology
Design intuitive color palettes that effectively communicate spatial information while maintaining visual harmony. Use sequential color schemes for continuous data like elevation or temperature. Apply diverging palettes to highlight contrasting values in demographic or environmental data. Implement qualitative color schemes for categorical data such as land use or zoning. Create custom symbols that scale appropriately in 3D space and remain legible at various viewing angles. Consider color blindness accessibility when selecting your palette combinations.
Optimizing Performance and Load Times
Creating efficient 3D map visualizations requires careful attention to performance optimization to ensure smooth user experiences across different devices and connection speeds.
Data Compression Techniques
Implement efficient data compression methods to reduce file sizes without compromising visual quality. Use vector tile compression for base maps reducing payload sizes by up to 80%. Convert high-resolution textures to WebP format for better compression ratios. Utilize GeoJSON simplification algorithms like Visvalingam or Douglas-Peucker to optimize complex geometries. Consider using quantized mesh formats for terrain data to achieve optimal balance between detail and file size.
Level of Detail Management
Design a dynamic Level of Detail (LOD) system to adjust rendering complexity based on viewing distance and device capabilities. Implement mesh decimation techniques to reduce polygon counts for distant objects. Set up distance-based texture streaming with multiple resolution variants. Use quadtree structures for terrain tiles loading only necessary detail levels. Configure automatic geometry simplification thresholds based on zoom levels and viewport size.
Browser Compatibility Solutions
Ensure cross-browser functionality by implementing progressive enhancement strategies for 3D features. Use WebGL feature detection to provide appropriate fallback options for older browsers. Implement polyfills for essential WebGL extensions where needed. Create adaptive rendering pipelines that adjust visual quality based on device GPU capabilities. Test performance across major browsers including Chrome Firefox Safari and Edge to maintain consistent user experience.
Testing and Validating 3D Map Visualizations
Thorough testing ensures your 3D map visualizations perform optimally across different scenarios and platforms.
User Experience Testing
Implement systematic user testing protocols to evaluate your 3D map’s usability. Conduct task-based assessments with diverse user groups including GIS experts novice users and domain specialists. Track key metrics like time-to-complete navigation patterns and error rates using tools like Hotjar or Mouseflow. Document user feedback about interface responsiveness control schemes and visual clarity to identify areas for improvement.
Understand your website's performance with Cave Bits! This tool delivers clear, actionable analytics, revealing visitor behavior and key traffic sources to optimize your online presence.
Cross-Platform Compatibility
Test your 3D visualization across multiple browsers devices and operating systems. Use browser testing tools like BrowserStack or LambdaTest to verify WebGL support CSS3D rendering and touch interactions. Check responsiveness on different screen sizes from desktop monitors to mobile devices. Validate that essential features like layer controls zoom functionality and data tooltips work consistently across Chrome Firefox Safari and Edge.
Performance Benchmarking
Monitor crucial performance metrics using tools like Chrome DevTools or WebGL Inspector. Track frame rates memory usage and load times across different data volumes and interaction scenarios. Focus on:
- Initial load time: < 3 seconds
- Sustained FPS: > 30 frames
- Memory usage: < 500MB
- Asset loading: < 1 second
- Interaction delay: < 100ms
Create automated tests using Lighthouse or WebGL Benchmark to maintain consistent performance standards.
Incorporating Advanced Visualization Features
Take your 3D map visualizations to the next level by implementing cutting-edge features that enhance user engagement and data comprehension.
Time-Based Animations
Transform temporal data into dynamic visualizations using WebGL-powered animations. Create smooth transitions between different time periods by implementing requestAnimationFrame() for fluid frame updates. Use libraries like D3.js or Three.js to animate features like urban growth patterns population movements or climate changes. Set precise timing controls with customizable playback speeds frame rates and timeline sliders to help users explore temporal patterns effectively.
Virtual Reality Integration
Convert your 3D maps into immersive VR experiences using WebVR frameworks like A-Frame or Three.js. Implement head-tracking controls stereoscopic rendering and spatial audio for enhanced immersion. Configure VR-specific interaction methods including teleportation hand controllers and gaze-based selection. Use LOD (Level of Detail) techniques to maintain smooth performance while rendering complex geographical data in VR environments.
Augmented Reality Applications
Deploy 3D maps in AR using frameworks like AR.js or Apple’s ARKit. Create location-based AR experiences by anchoring map features to real-world coordinates using GPS and device sensors. Implement gesture recognition for intuitive map manipulation including pinch-to-zoom and rotation controls. Configure occlusion handling to blend virtual map elements seamlessly with real-world environments while maintaining proper depth perception.
Master ARKit and build immersive augmented reality apps. This guide offers practical techniques for leveraging Apple's AR platform with step-by-step projects.
Making Your 3D Maps Accessible and Shareable
Share your 3D map visualizations effectively across platforms while maintaining quality and functionality.
Export Options and File Formats
Export your 3D maps in multiple formats to ensure broad accessibility. Use GeoJSON or KML for vector data sharing WebGL-based scenes as HTML files for web deployment. Convert complex 3D models to glTF format for optimal performance across platforms. For static views export high-resolution images in PNG or JPEG formats preserving transparency when needed. Consider OBJ or FBX formats for sharing detailed 3D models with other visualization software.
Embedding in Web Applications
Integrate your 3D maps into websites using iframe elements or JavaScript APIs. Implement Mapbox GL JS or Cesium for seamless web embedding with full interactive capabilities. Use responsive design principles to ensure proper scaling across devices. Add custom controls through HTML elements to maintain consistent functionality. Configure CORS settings to enable cross-domain resource sharing while maintaining security protocols.
Collaboration Tools
Leverage version control systems like GitHub to track changes and manage collaborative map development. Use cloud-based platforms such as ArcGIS Online or Mapbox Studio for team editing capabilities. Enable real-time collaboration through shared workspaces in platforms like Google Earth Engine. Implement commenting systems for feedback collection and revision tracking. Create shareable links with customizable permission settings for different user access levels.
Best Practices for Future-Proofing Your 3D Maps
Stepping into the world of 3D map visualization opens up exciting possibilities for presenting spatial data in engaging and meaningful ways. By following modern development practices and staying updated with the latest tools you’ll create robust and scalable visualizations that stand the test of time.
Remember to document your workflow thoroughly and maintain clean modular code that’s easy to update. Your 3D maps will continue evolving as new technologies emerge so building with extensibility in mind is crucial. Focus on creating responsive designs that work seamlessly across devices while implementing progressive enhancement for broader accessibility.
The field of 3D mapping is rapidly advancing with innovations in WebGL AR and VR. By mastering these fundamental techniques and remaining adaptable to new developments you’ll be well-equipped to create impressive visualizations that push the boundaries of spatial data representation.
